Related questions
In one previous „recipe“ there were words about the Q&A feature that Power BI supports. Since November 2018 it has been upgraded so that it is now possible to “ask subquestions” which represent a modification of the initial query. Also, this option also allows you to track the question history so, in that way, you can make interactive reports that users will adore.
To begin with, create a simple report showing sales of items by quantity. The Q&A option is triggered by clicking the Ask a question button. Alternatively, we can add this button to the report itself, which can be useful if we choose to publish it on the web.
After choosing that option a window will appear where you can enter a question on the basis of which Power BI creates a visual that shows the response report. When you enter questions, you need to use a combination of English and the names of the reporting dimensions and measures. Power BI itself concludes which visual to use, and you can emphasize it through the question, so that you get the desired chart.

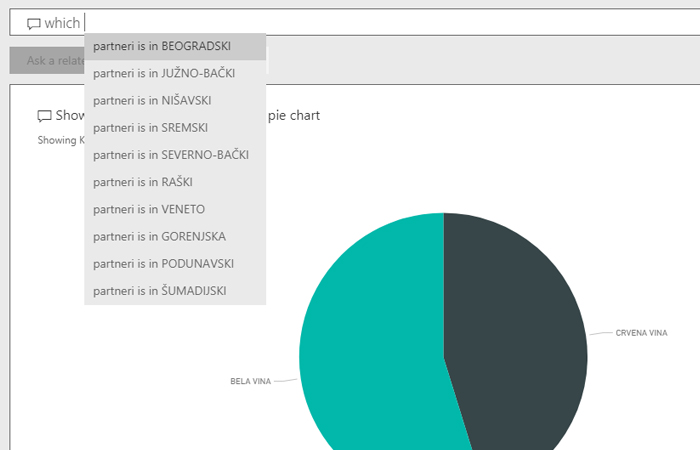
By clicking on the Ask Related Question button, you are setting up “subquestions”, which are in fact queries that further filter the initial report that you got. The history is remembered, so by scrolling down you can get an insight into what kind of questions you have asked and what answers (reports) you’ve got.