Power BI Desktop
In one of the earlier posts I wrote about that PowerBI comes in many “flavors”: as a Cloud Service (PowerBI.com) as a development environment (PowerBI Desktop), as application for mobile devices available on Windows, Android and iOS platforms (PowerBI Mobile). Since the majority of you who are reading these lines deal with reports development I decided to demonstrate you, in a practical example, how to use PowerBI Desktop.
To download PowerBI Desktop you need to go to the site PowerBI.com, select the menu Products and choose this product. This step will take you to download page, further you only need to click on Download button and retrieve 32-bit or 64-bit version of this applications. Keep in mind that PowerBI is still in development stage. Every month or two comes a new version with enhanced functionalities, so if want always to be up to date this is a site you will frequently visit.
After completing the installation you’ll start PowerBI Desktop by clicking or double-clicking its shortcut icon, as any other Windows application. Its working environment is quite different from what you could see at PowerBI cloud service. As a result you will not have a common view of the data sets, reports and dashboards.
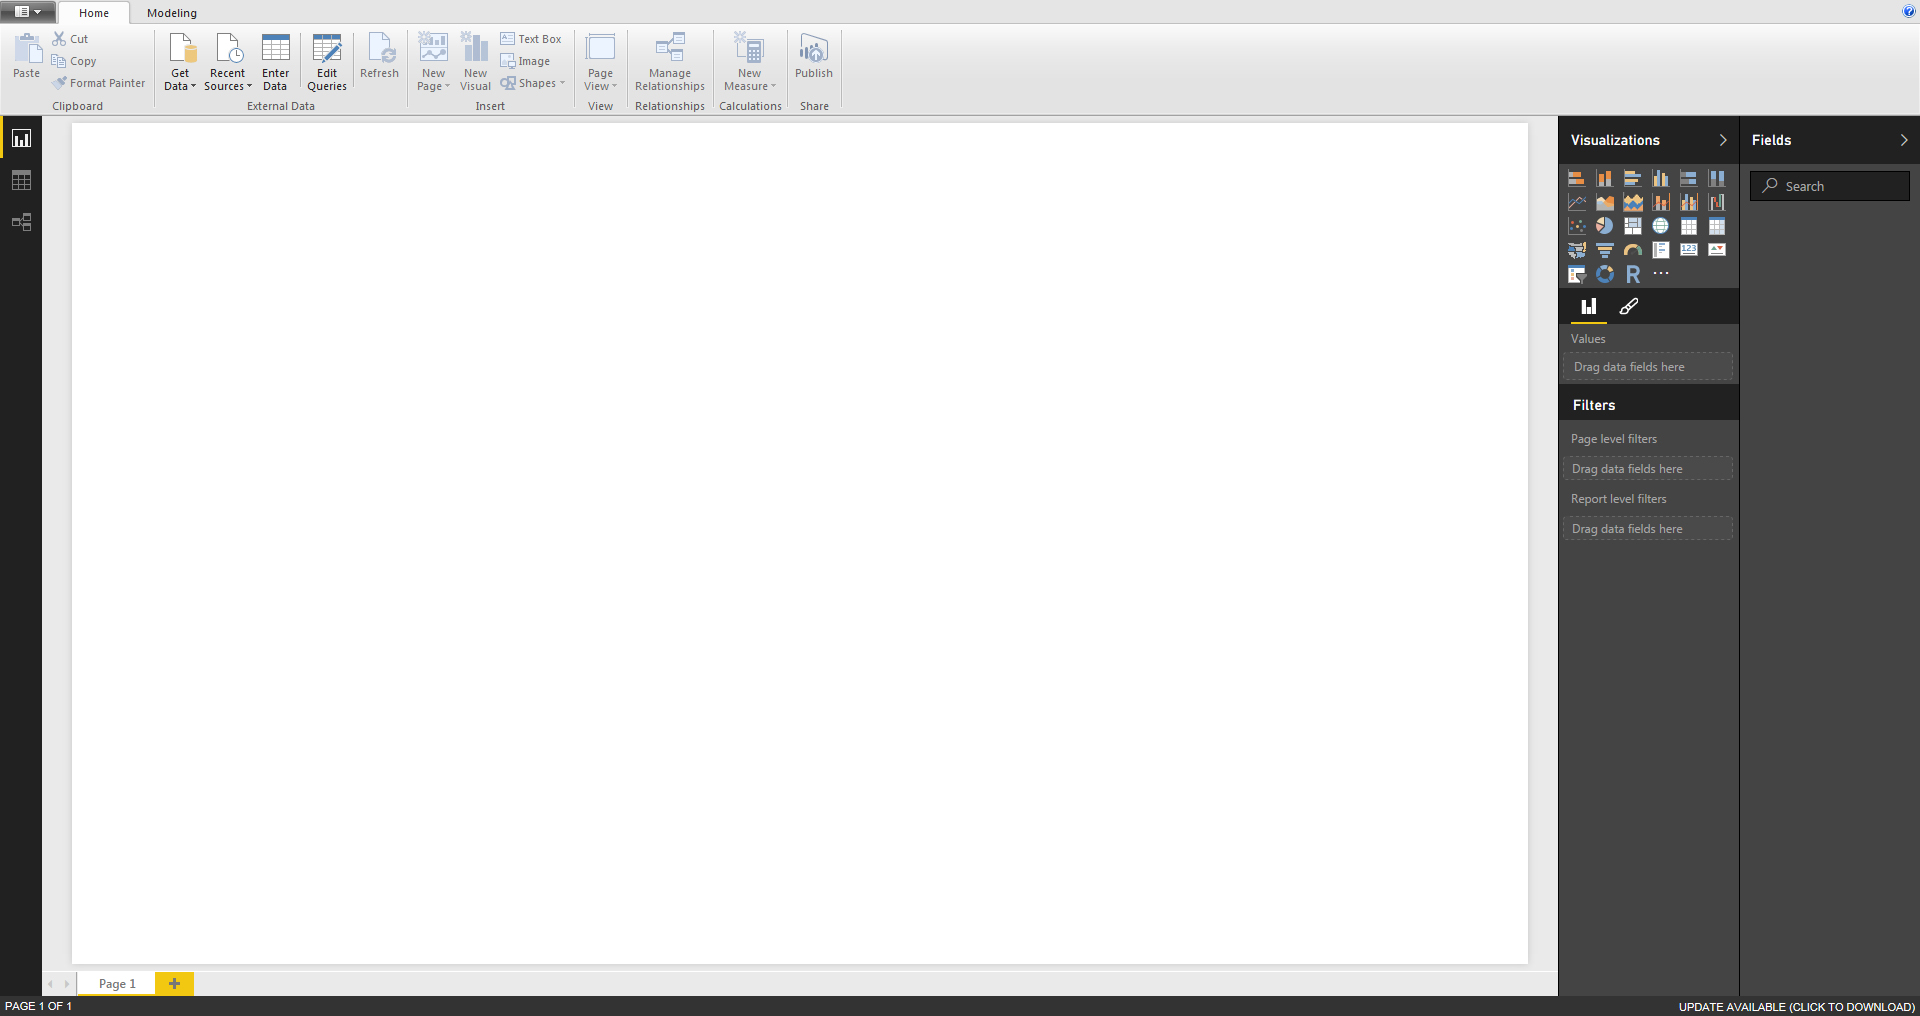
On the left side in main window there is a dark grey menu with three icons, from up to down, called: Report, Data, Relationships. First one leads you to a report design mode, second shows data tables and here you’ll create measures and calculated columns, and the third shows diagram of the data model; here you can add tables and create relationships between them, just like in PowerPivot.
Central part of the window is area designated for creating reports, watching data and modifying data model.
Similar to PowerBI cloud service, on the right side there are two panels: Visualizations and Fields. First one contains visuals such as: charts, maps, tables, cards, slicers… Second contains a list of all tables within Data model with reporting dimensions (fields, calculated columns, measures).
On the top there are two ribbons: Home and Modeling. Here you can find additional options for creating PowerBI reports. Home contains most commonly used options, and Modeling mostly contains options for adding and formatting measures.
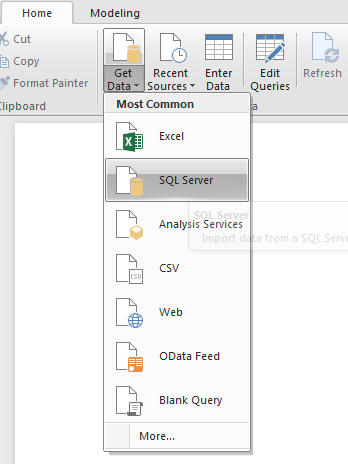 Earlier I was talking about how to import data from Excel file, and now I’m going to show you how to connect to the database which runs ERP solution used by your company. In order to achieve this it is necessary to open the Get Data menu, located in the Home toolbar, and then click on SQL Server (assuming SQL Server database is the ERP host). A window opens in which should enter the server name and the database name where the ERP is located. If you are unsure about what you need to enter, contact your database administrator. In the same window there is a menu Advanced options. After you open it you can see two options. In the first you can set Command Timeout, which is the maximum time that application is waiting for a response by the database before it closes connection (sometimes connection is bad and it is necessary to increase the waiting time for a response). In the second you can directly integrate SQL query that connects to the database and retrieves the data. In previous posts, where I wrote about Data model, I described the procedure of adding and connecting more tables within a model. In practice most common scenario is that you write SQL query where you take data from several tables and import it into one table within a model, which is later used to create reports.
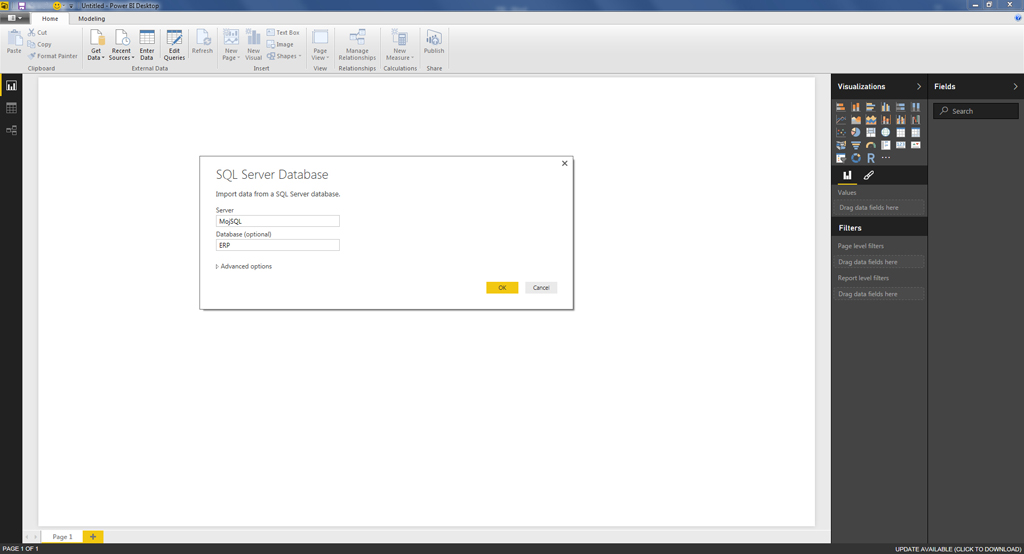
Then move to the next step. In case you have not entered a database name now it will be offered you to select it, as well to select one or more tables to create the report. Select Related Tables button allows you to select all related tables, if any. To connect do the database further click Load.
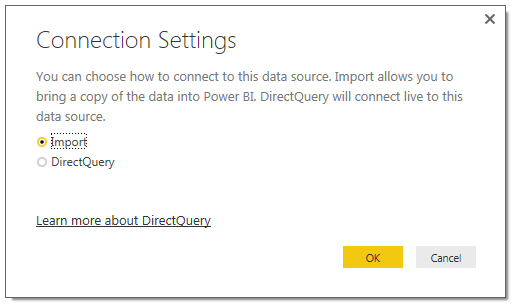
Another window opens that offers two options: Import and Direct Query. Choosing the first option shall be importing data into the model (copying and compressing data), and with another you can establish direct connection to the database. I like to advise users to always choose the first option! Clicking the OK button completes the process of creating connection to the database.
Home ribbon holds a menu Recent Sources in which you can find previous connections. So it is not necessary always to create a new database connection. Enter Data option is used to manually enter a data table. It is seldom used, but can be handy for testing purposes.
After you import data save the report. A saved file gets PBX extension which is common for all local PowerBI reports.
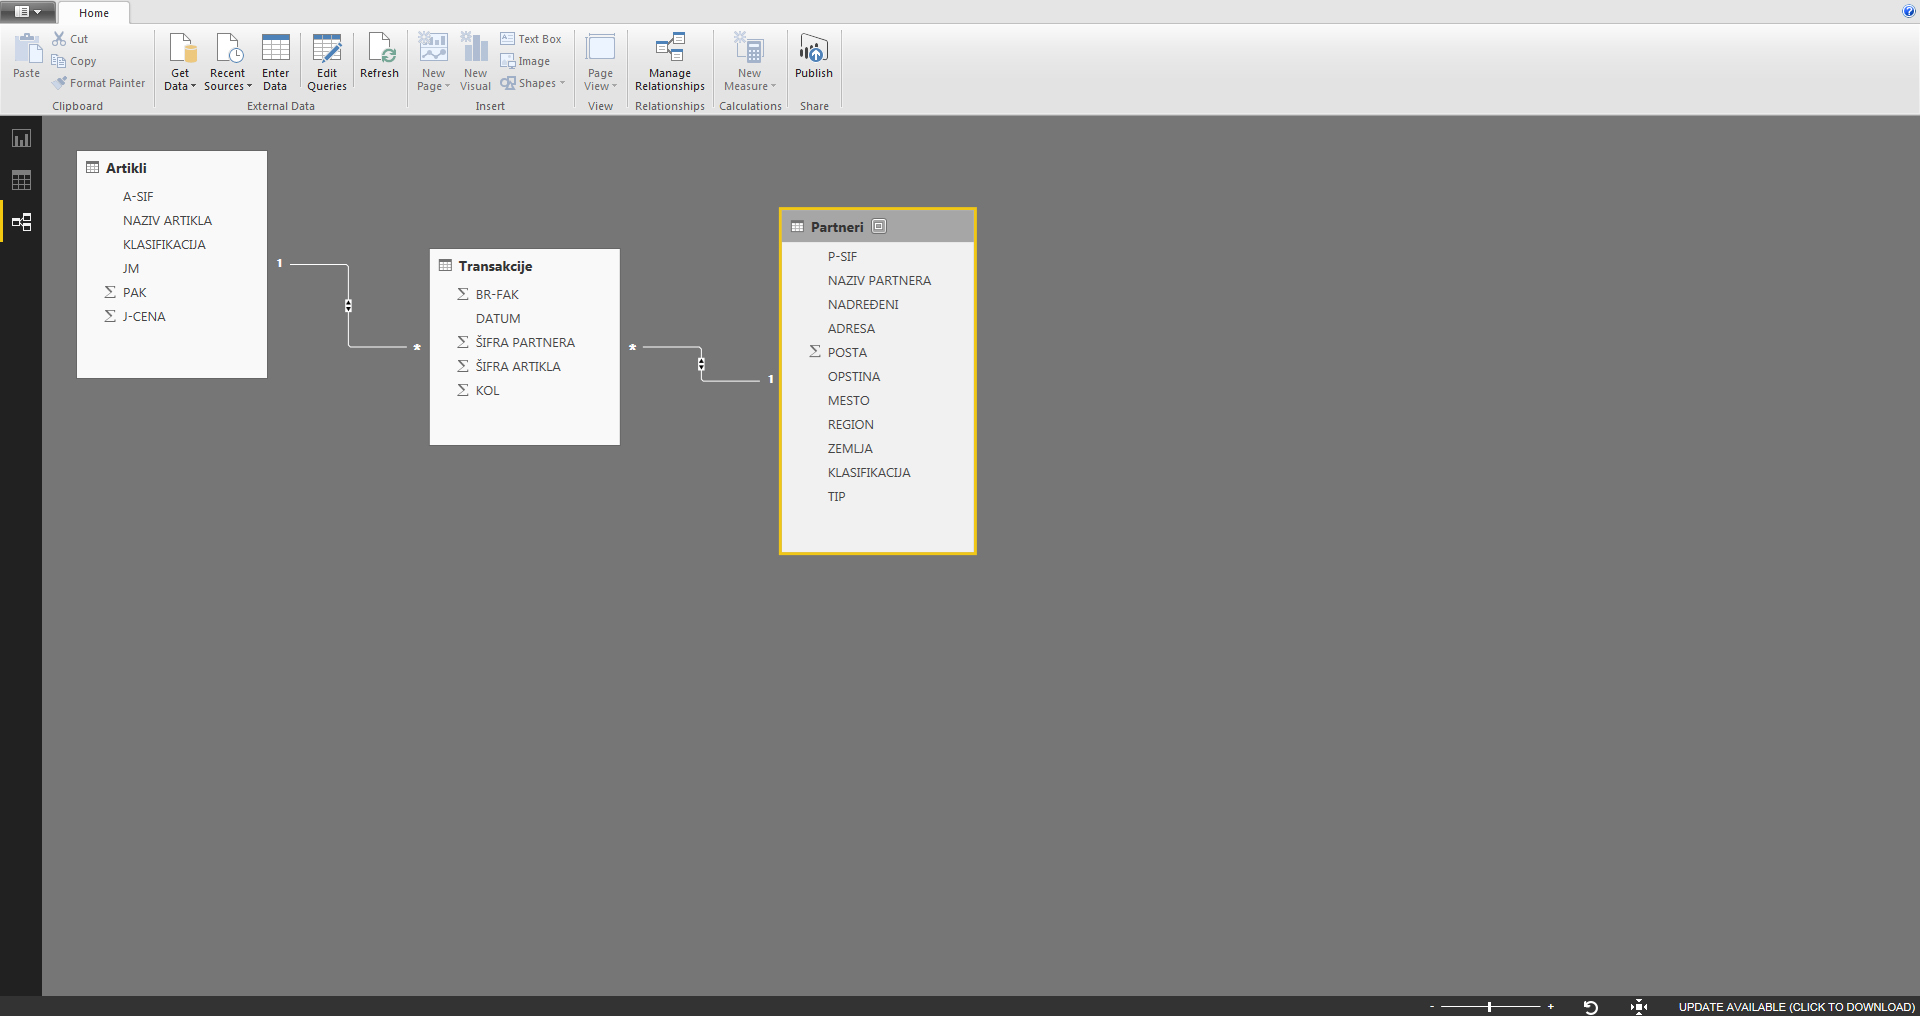
After creating a database connection should check table relationships. To do that choose Relationships view. Here you can create or remove relationships between tables.
Further let’s create some measures by writing DAX expressions. Select Data view, and then in Home ribbon find a menu New Measure. Here you can create New Measure or New Column (calculated column). Choosing first options helps us to create following measures:
PrometKOL:=SUM(Transakcije[KOL])
PrometIZN = SUMX(Transakcije,Transakcije[KOL]*RELATED(Artikli[J-CENA]))
PrometKOL is used to calculate sales by quantities, PrometIZN to calculate sales by amounts (amount=quantity x price). As you can see, we have created measures in the same way as we would do it by using PowerPivot Excel add-in.
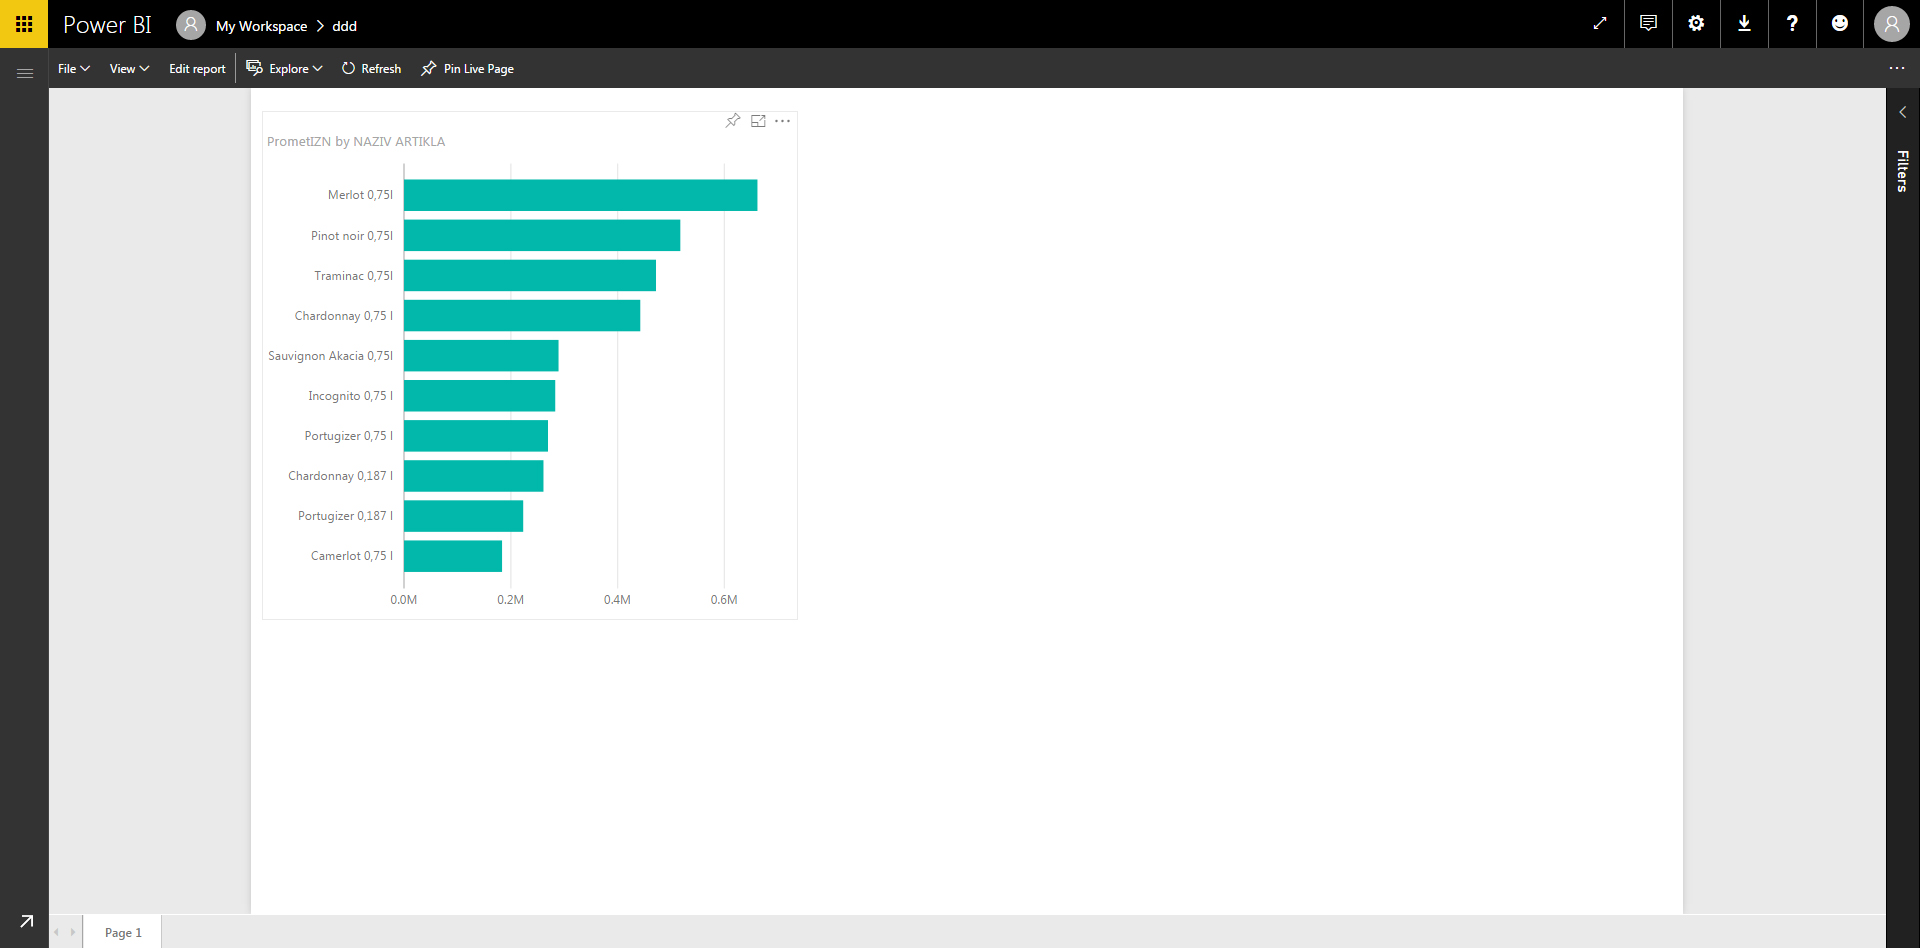
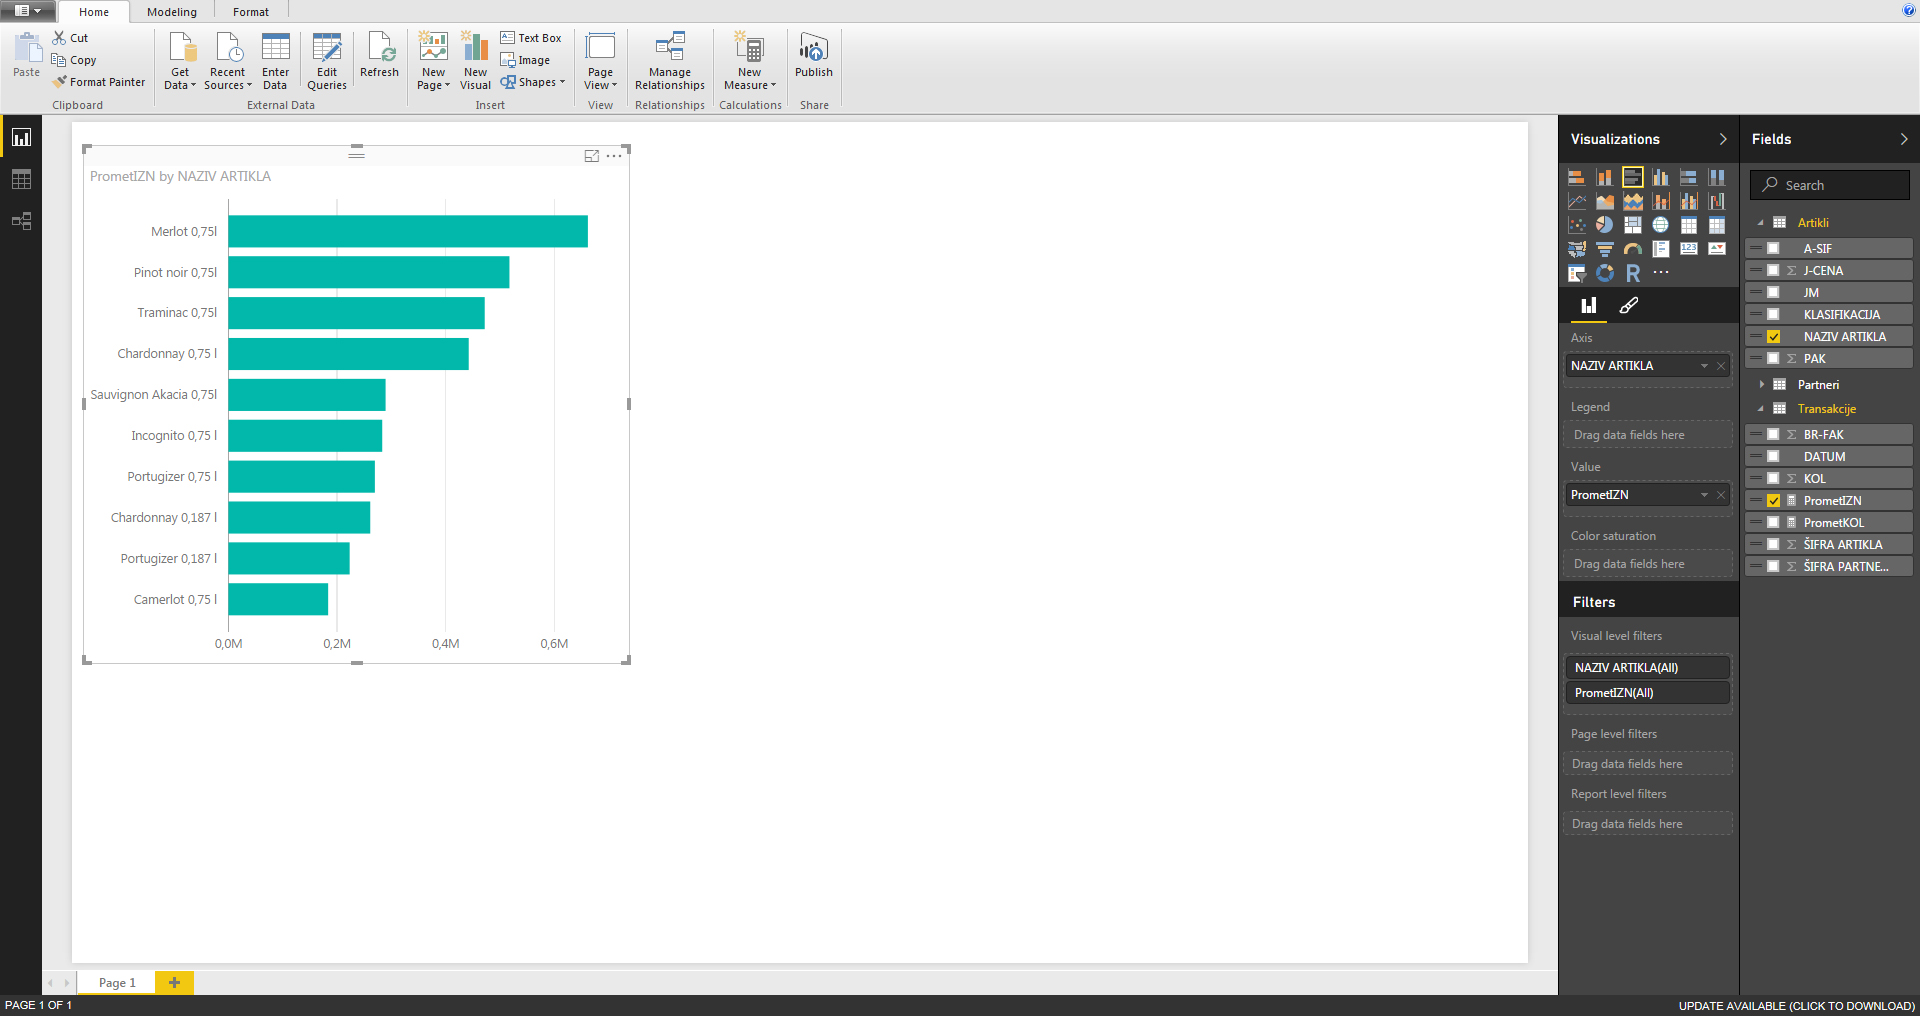
I’ll be back on Report view and make a simple report. First, in the Fields panel on the right I’ll choose column NAZIV ARTIKLA (Item name) and measure PrometIZN. Then in Visualizations panel should choose Clustered Bar Chart.
The process of drafting the report is the same as when using PowerBI service. Once a report is created that it can be “transferred to the cloud” by publishing onto existing PowerBI account. It is necessary to save the report, further click on the Publish button in the Home ribbon and enter a username and password (if you have not done it before and saved the settings). After a short time, the application will notify you of the success of the operation and if everything went well. Also the report will show in PowerBI portal, and you can further add it to a dashboard.
If you use free PowerBI service process of refreshing reports takes two steps. First should click on Refresh button that belongs to Home ribbon, to retrieve data from a source (database), and then Publish to publish it on PowerBI. PowerBI Pro enables you to create a gateway by which can set synchronization done automatically. Both free and paid version have lots of functionalities. Play with them and make beautiful reports!