Advanced Data model options
In addition to options we use on daily basis Data model has some advanced options too. With them, we can define the perspective view on the table. Also, we can determine the behavior of columns when they are dragged in the Pivot Table, as well as to set additional attributes table that can be used when creating reports. Finally, it is possible to make one or more synonyms for each column, which later makes it easier to search the model.
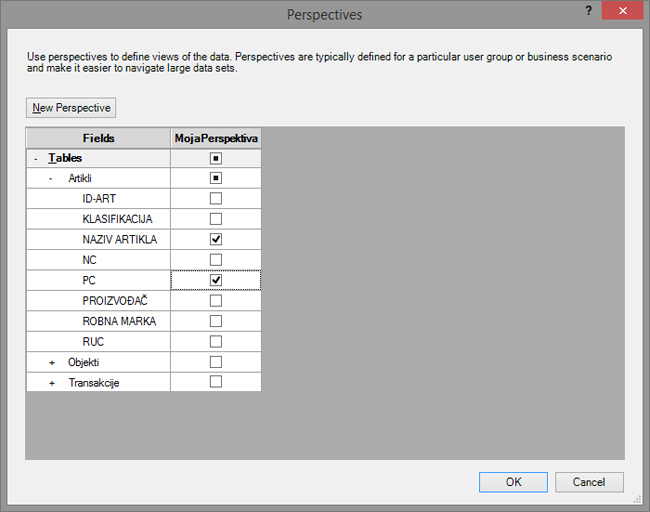
Advanced options for work in the model  are activated by opening Data model’s window, selecting option Manage in the PowerPivot ribbon, and then clicking File tab to open the menu where is offered an option Switch to Advanced Mode. After its activation Advanced toolbar will appear. First, there are options for designing and choosing perspectives. Perspectives are views within a model. However, since version 2013 they are not used as before, when they had the full functionality of view, but we can use them to narrow the huge table on a number of selected columns that we want to see in the model. We create a Perspective by clicking the Create & Manage on the Design ribbon, and then on the New Perspective in the dialogue window that opens after this action. On the right side will appear a new column. In its header should enter the name of the new perspective. Then, should claim to be all the columns to be displayed in the selection. Clicking OK performs the creation of perspective.

Option Create&Manage also enables modifying and deleting perspectives. You just have to run it, position above the title of perspective and open a small menu that offers the possibility to change, delete or copying a perspective. The default perspective is called (guess how?) Default. Right from the option Create & Manage is a menu where we can change the default perspective, and therefore column in a table that can be seen in the window of the Data model.
When you select a column by using option Summarize By it can be determined the default aggregation function for that column. For example, if we did this for a column KOL (quantity) and have chosen AVERAGE function, the next time this column is dragged the field Values of Power Pivot report it will average instead performing sum of data.
Option Default Field Set is used for the selection of default fields of a table. By running this option you can choose the default fields. If you then create a Power View report, and drag and drop the entire table in the field of reporting, that will appear only the default fields (columns). Option Table Behavior is used to set the field which is the primary key, as well as other unique fields in the table. It can be used to determine the name and the image data sets to be used in the Power View report.

After selection of the column it is possible for it to determine the category of data. Option Data Category is used when we want to emphasize that in a column are the dates, web sites or geographic data.
Synonyms option is used to determine one or more synonyms for the names of the columns in the tables. After its launch on the left we see Data model, and on the right a list of synonyms. For example, for the column KOL we can enter synonyms: QUANTITY, QTY, KOLIČINA, etc. These synonyms can later be used in the search model, and lately they are applied when setting questions in PowerBI reporting tables.

