What language do you speak?
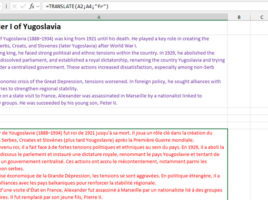
The TRANSLATE function became part of Excel in July 2024, and recently we have another useful function that you can use to detect the language in which a text is written. It’s a new DETECTLANGUAGE function, and you can use it in conjunction with the TRANSLATE function.