Custom visuals
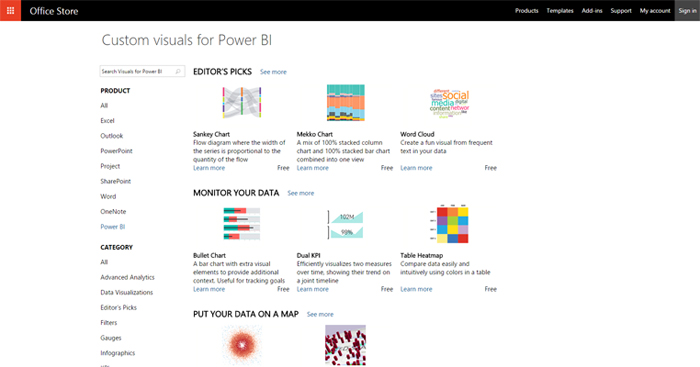
PowerBI Desktop has a number of tools for data visualization- visuals. They allow the data that is imported into Model to be used for creation carts, tables, variety of charts, slicers … Sometimes there is a need for specific visualization tools that are not offered in the standard range. We call them Custom visuals. You can find them all in the Office Store, download desired visual, install it, add appropriate data set and bring data to life!
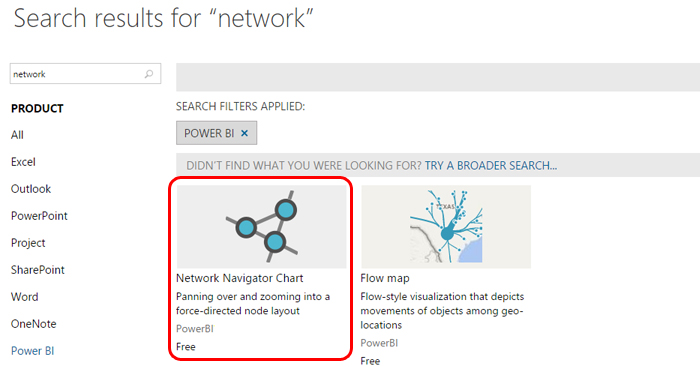
Until recently all visuals could be downloaded from address powerbi.com/visuals, and since May 31 they will be all within the Office Store. In following example I will show you how to install and use Network Navigation Chart, visual that is suited for creating network diagrams. After visiting Office store enter the term „network“ in search field and this visual will be shown as a search result. By clicking on them and following several another steps you will download it in your local Download folder.

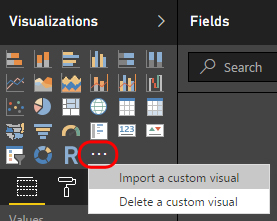
 To add it into PowerBI Desktop, after you have started this application go to the menu Visualizations on the right. The last of the available visual’s icon is represented by “…”, and clicking on it opens a menu where you should select the Import a Custom Visual. In this menu, there is another option Delete a Custom Visual and it is used to remove previously imported a visual into palette. Clicking the first option first opens a window in which you confirm that you want to add a new visual, and further a file browsing window where you need to go to the folder Downloads folder and select it. After performing this action a visual will appear in the palette.
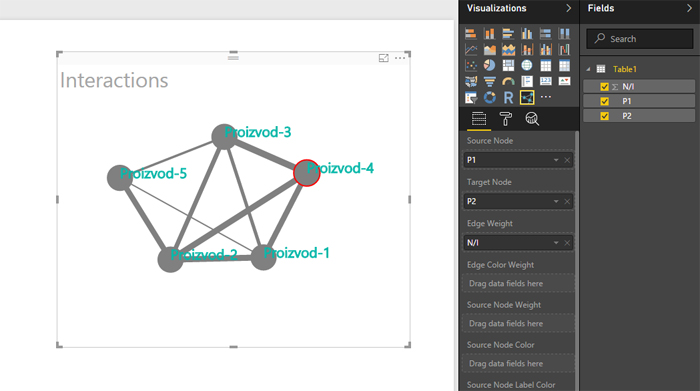
Each chart requires a specific dataset. In order to illustrate the data used by network diagram you need to have table that contains objects that are interacting each other and number of these interactions. In this case, table contains list of five items (PROIZVOD-1 … PROIZVOD-5) and their interactions in response to the question: “If the PROIZVOD M is purchased how many times PROIZVOD N is purchased as well”? This table is imported into the Model by clicking on the Get data, and connecting with the desired Excel file.
After data is imported, you further need to add reporting dimensions and choose Network Navigation Chart visual. In the Source node drag field P1, in Target node drag P2, and in Edge Weight finally drag N/I. By additional settings you can add title, labels, change display colors, adjust animation and change other attributes of this visual.
At the end, I’d like to mention that each visual is different. Depending the data that it brings to life it will have different attributes and settings. Be ready to use some time to learn how to use each new visual.
