Data profiling tools
When importing tables from data sources there is a possibility of error or import of empty values. Also, in order to optimize the model, there is often a need to see the structure of the data according to the columns. One way to achieve this is to filter the table and view the filter values. It can serve! However, Power Query has built-in tools that allow us to easily view data statistics …
Open the Power Query Editor, then select the View ribbon. You will see that the Show Whitespace checkbox has already been selected. It is used to automatically apply escape sequences that may be in the text within a column. This means e.g. if there is a row break sequence within a text you’ll the content in two rows. The Monospaced checkbox allows you to change the font in which data is displayed into Monospace.
The Column quality checkbox is used to display valid values, blanks and error values. At the same time, it changes color of the base of the column header so that we, just browsing colors, can quickly conclude whether there is need for more detailed analysis. In addition to Valid, Error, and Empty, it can also have a value of Unexpected Error (dashed red line) or Unknown when the column quality is unknown and it probably has errors (dashed green line).
Column distribution enables display of a value distribution chart. It also allows us to see Distinct values or those that appear only once (Unique).
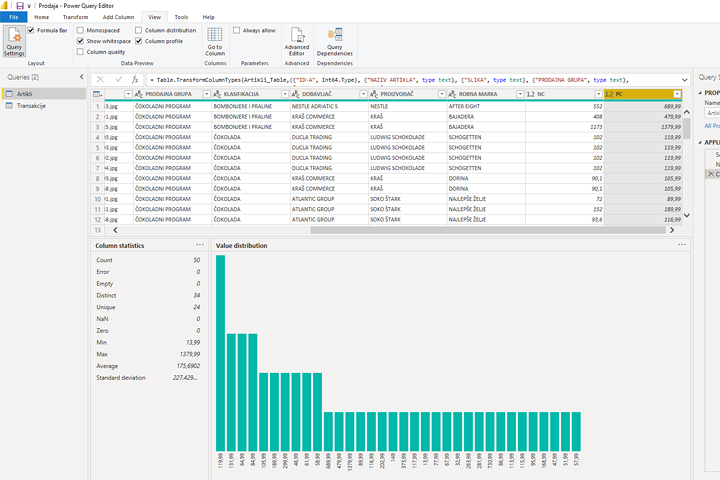
Column Profile option also display distribution chart and many additional statistics by which we can analyze column values.