Displaying details
Power BI visualizations often have a Tooltip section with which is a feature that enables focus on specific attributes. For example, if you hover an item shown in the report, you can see information about the manufacturer, number of brands, average price, etc. Something like this does not exist in Excel, but if we can mark items in some way, it is possible, with a little improvisation, affect the display of attributes. To do this, we will use the Checkbox option…
Let’s start with the sales report, which shows the names of the items and the sum of sales by item, which we calculated using the SUMIF function. The values from the main Transactions table are summed up, and there is also a secondary Items table where you can find details about the items.
To the left of the item name, a column has been added in which we have inserted Checkboxes, and we will use them to initiate the display of details.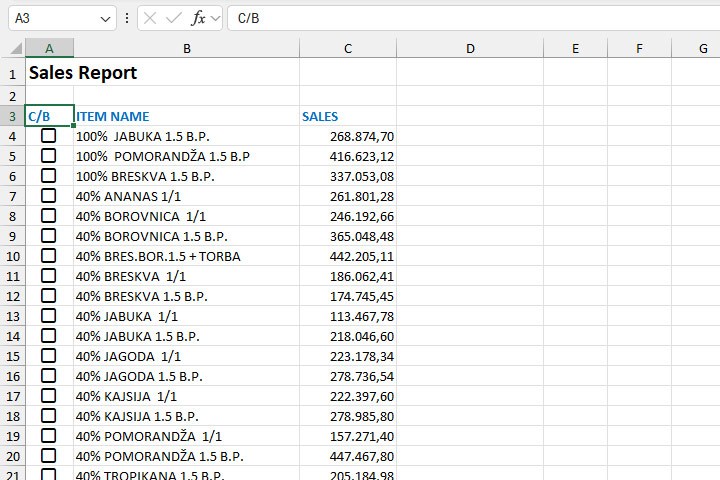
For example, let’s show the name of the manufacturer for the selected item! In the cell to the right of the item name, write the formula:
=” Manufacturer: “&XLOOKUP(B4,Artikli[NAZIV ARTIKLA],Artikli[PROIZVOĐAČ],””)
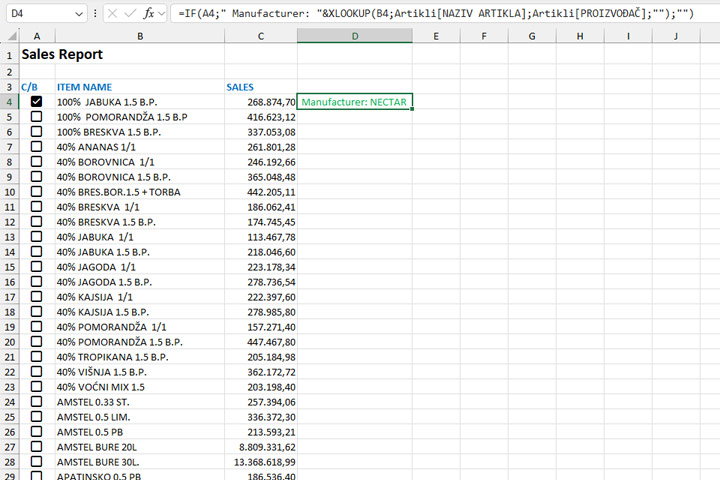
In order for the formula to be displayed only if the checkbox is activated, we will check its status. Let’s fill in the formula:
=IF(A4,” Manufacturer: “&XLOOKUP(B4,Artikli[NAZIV ARTIKLA],Artikli[PROIZVOĐAČ],””),””)
In this way, every time we select the Checkbox to the left of the item name, we will see its details. Convenient, isn’t it?