Editing report elements
Since March 2018, PowerBI Desktop has several new options for viewing and editing reports. First, there is an option to highlight one visual in relation to others, which is in its context menu. And then, there are a few more options that allow you to capture your favorite report views, view and manage objects in a report, lock objects, show field properties, and a set way to synchronize slicers…
If you have more visuals on the screen and want to emphasize some of them, you can do this by activating Spotlight option. It is located in the context menu of the report accessed by clicking on the icon represented by the symbol “…” and placed in its upper right corner. After launching, the selected visual will be highlighted, while all others on the screen will be blurred.
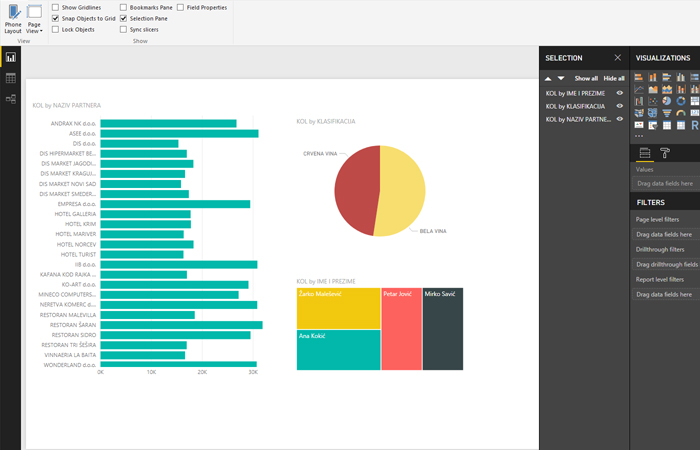
View ribbon has several options to manage the report view. By marking the Selection Pane checkbox action will display selection panel. It provides an overview of all reporting objects, and by clicking on an icon that resembles an eye, to the right of the visual name, can choose to hide it or re-display it. Also, when selecting multiple objects, we can perform alignment in the report. The Lock Objects option allows you to lock the selected visuals, after which can no longer move them. Bookmarks Pane opens a special panel where we can save your favorite report layout, similar to when we add favorites to the Internet browser. Field Properties allows you to display dimensional properties as a tooltip, and Sync Slicers opens a panel in which we choose whether the slicer is synchronized with its „twins“ located on other pages of the report.
Power BI has themes, similar to Microsoft Office applications. The theme represents a predefined color and fonts scheme used to display objects. The Switch Theme menu allows you to select a new theme or return to the default one.
