
MS Fabric as a data source
Objects (data sources) within the Microsoft Fabric organizational environment can be easily leveraged in the Power BI Desktop application to create reports. These can be: Lakehouse, Warehouse, Datamarts (segments of the data warehouse, grouped by functional units, suitable for reporting), SQL Databases, KQL Databases… In this article, you will learn how to use Lakehouse tables to create reports.
Open Power BI Desktop. It’s important to know: it needs to be connected to your tenant in order for you to have access to the data stored on it. Create a blank report. Next, start importing your data, open the OneLake catalog, then select Lakehouses…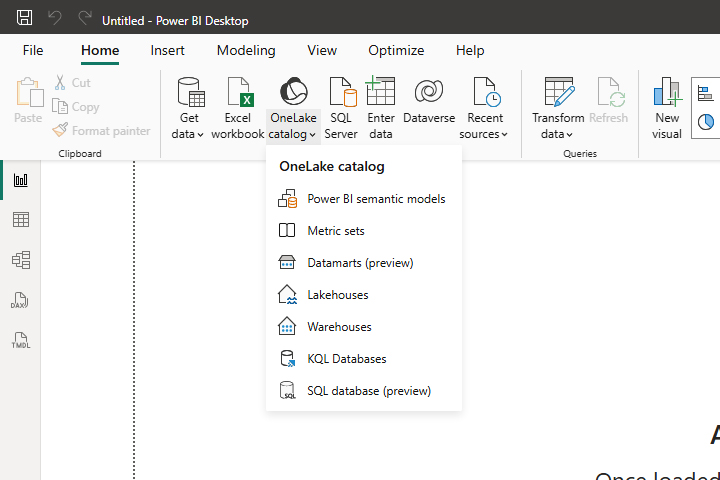
Select a Lakehouse called Analysis. When connecting, instead of Connect, select Connect to SQL Endpoint. This way, you will be able to easily extract the data needed for reporting.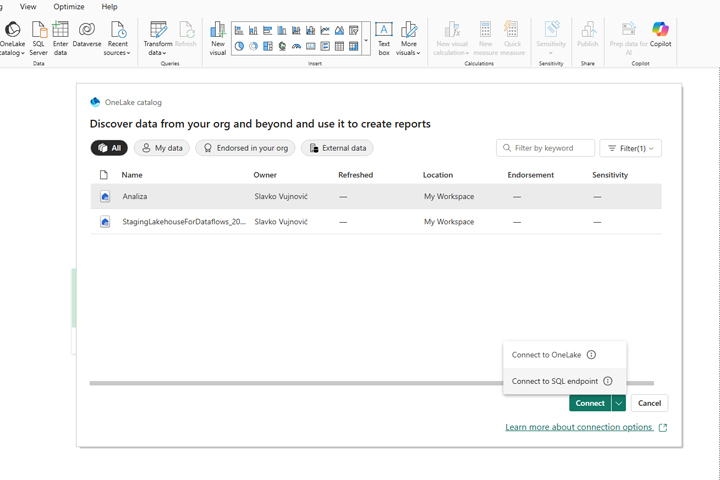
Then select the Transakcije (Transactions) table and click on Load.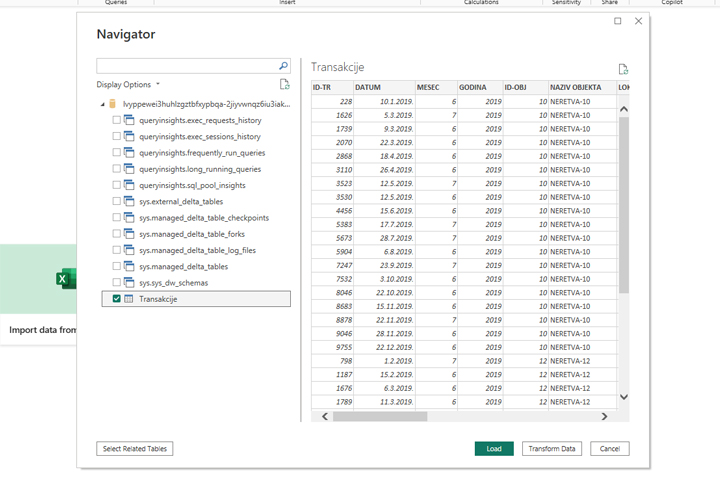
Power BI will ask you if you want to use Import or Direct Query mode to connect to a table. Select Import. In the Data panel, on the right, the Transakcije (Transactions) table will appear with all its reporting dimensions. You can now continue to create reports as if you had previously imported data from another source.