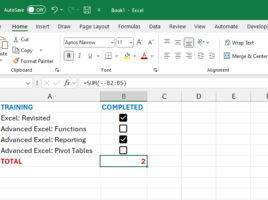
Displaying details

Power BI visualizations often have a Tooltip section with which is a feature that enables focus on specific attributes. For example, if you hover an item shown in the report, you can see information about the manufacturer, number of brands, average price, etc. Something like this does not exist in Excel, but if we can mark items in some way, it is possible, with a little improvisation,  affect the display of attributes. To do this, we will use the Checkbox option…

Checkbox

Checkbox is not a new Excel feature. We were able to add checkboxes to Excel reports earlier, by choosing some of the controls offered in the Developer ribbon (Form Controls, ActiveX Controls). Recently, Microsoft has made this option much more accessible, and in the following post you will find out how to add a checkbox to your report and how you can analyze such reports.