Highlighting found values

When working with large tables, it is often necessary to make their search easier. One of the ways to do this is by applying the option for conditional formatting, with which we can mark all rows in which a value corresponding to the given criteria was found. In the next “recipe” you will find out how to perform such task.

Conditional formatting of data labels

Data labels in charts are always useful because they implicitly show us the value of the series, without the need to look at the axis. However, in traditional charts, they are always formatted the same way; they are displayed in the same font size and style, the same color… Power BI Desktop recently got the option of conditional formatting of these values, which makes the reports much more vivid.

Traffic lights

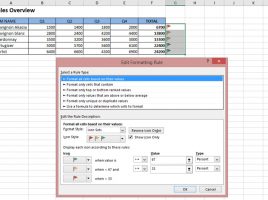
Conditional formatting is an Excel functionality that is often used, and allows you to emphasize certain parts of the report. Typically, conditional formatting is used within the same column, but how do we display “traffic lights“, icons that indicate a change in business, within another column? This is a very simple procedure, and if you want to find out how this is done, you have it in this “recipe”.

Physical examination

Are you overweight? Weight gain is not just an aesthetic problem, it can be the cause of many diseases, so companies conduct an annual physical examination to check the health of their employees. In this example, you will learn how to calculate BMI (Body Mass Index), a coefficient that indicates whether you are below or above the optimal body weight, and how to use conditional formatting to mark those who have unfavorable BMI.

Differences between tables

In your day-to-day work, many of you copy data from a company’s business information system or some spreadsheet where they are exported to create the necessary reports. The problem arises when the data changes. How to trace where the change occurred? What is the difference between a source and a derived table? In the text that follows, you will see how to use the INDEX and MATCH functions, as well as the conditional formatting technique, to highlight the differences between the tables.