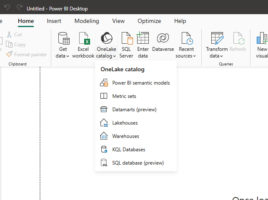
MS Fabric as a data source

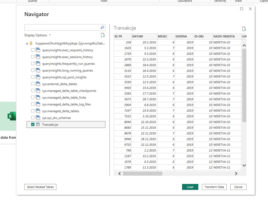
Objects (data sources) within  the Microsoft Fabric organizational environment can be easily leveraged in the Power BI Desktop application to create reports. These can be: Lakehouse, Warehouse, Datamarts (segments of the data warehouse, grouped by functional units, suitable for reporting), SQL Databases, KQL Databases… In this article, you will learn how to use Lakehouse tables to create reports.

OneLake catalog

Since Power BI has been transformed and become part of  the Microsoft Fabric platform, we have a number of new, useful options at our disposal. OneLake is the place where all of an organization’s structured, semi-structured, and unstructured data now resides, and is stored in an open Delta Parquet format for ease of access, sharing, and management . The OneLake catalog is a feature within Microsoft Fabric that works as a centralized place to store, find, analyze data.

Relationship view

Power BI, similar to Power Pivot, has a look at the tables and their relationships. Its advantage is that, from the very beginning, automatically detects relations between tables based on the name of the column that it discoveres as keys. From November 2018 the new, significantly enhanced Relationship view is offered, so in the following text it will be about what are its features and what is new.

Importing a table from the Internet

Importing a table from the Internet is a useful Excel option that came at the wrong time. Sometimes, when web designers created pages using the TABLE structure, the tabular data was in the tables (where they should be). Today, the approach to making web sites has changed, so DIV tags are used to display tabular data, which for some reason can not be recognized by Excel. Hence this option has limited application capability.