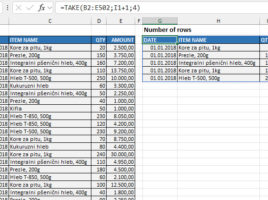
What language do you speak?

The TRANSLATE function became part of Excel in July 2024, and recently we have another useful function that you can use to detect the language in which a text is written. It’s a new DETECTLANGUAGE function, and you can use it in conjunction with the TRANSLATE function.

Sales overview in selected currency

When creating business reports, there is often a requirement that they should be displayed in multiple currencies, that is, the user can choose the currency in which a report is displayed. This can be achieved in several ways and one of them, very elegant, is with the help of the LAMBDA function. In this “recipe” you will find out how you can use it to display sales reports in different currencies.

Function PIVOTBY

Pivot tables have been with us for a long time and allow us to easily analyze data by changing the perspective from which we look at them. Recently, there is also a PIVOTBY function that allows us to get a similar report, but in an Excel spreadsheet. By marking rows, columns, values ​​and other parameters, a dynamic report is generated. Here’s a post about how to use this function…

Function GROUPBY

If writing SQL queries is in your job description I am certain that you, in great extent, inside SELECT command, use a GROUP BY clause that allows you to group row values by a given column and then apply an aggregation function, e.g. SUM, COUNT, AVERAGE, MIN, MAX… I have good news for you: we can achieve almost the same thing within an Excel report by using the GROUPBY function…

Analyze Data

A few years ago, Excel, which comes as part of a Microsoft 365 subscription, got the Ideas option. Now this option has been improved and is called Analyze Data. It enables, with the help of artificial intelligence, simple and fast data analysis to generate tables, pivot tables or charts according to user questions, which help user to visualize data in appropriate business reports.