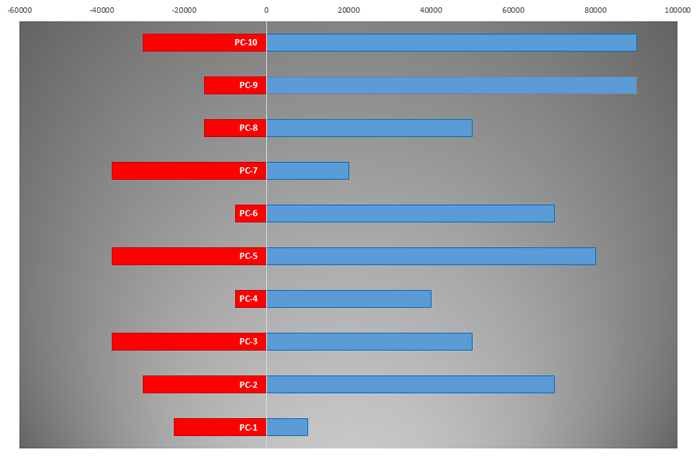
Win-Loss chart
If you are engaged in budgeting and cost analysis it will be useful to know how to create a Win-Loss chart. This is a type of Bar Chart chart which, on the left side, holds negative values (most often the losses), and on the right side positive values (most often the gains). On the left side there can be also shown the costs, and on the right side the revenues. Let’s take a look at how this chart works!
The data source is a three-column table. The first lists the names of the profit centers, in the second there is an income, and in the third expenses (costs). You can see their negative values in the expense column. In the example, we have pre-prepared data, and in practice, the value of this column will be multiplied by the number -1 in order to have the appropriate data for creating a chart.
Select the data in the table and then, in the Insert ribbon, select the option to create a Stacked Bar Chart. Excel will automatically create a Win-Los diagram.

Now you still have to fix it up a little. You can do this by removing the axis from the top of the chart, formatting the revenues so that they appear in blue, the expense to be displayed in red, etc. The final result is a report from which you can easily see how profit centers operate within your company.

