
Date hierarchies
Recent versions of Power Pivot possess the feature that automatically generates hierarchies and columns that calculate year, quarter, and month for date columns. It is automatically activated when you drag such column into a Power Pivot report. This can be of use, but it can also bother you. In the following text you will find out how you can turn on or off this Excel feature.
We have added and created relationships between following tables in Data model: ARTIKLI (Items), PARTNERI (Partners) and TRANSAKCIJE (Transactions). Further we created the CALENDAR table and connected it to TRANSAKCIJE via the date column. Then, several measures have been created. Amongs them Sales, which calculates sales amounts and Sales_SPLY, which calculates sales in same period last year. We dragged these measures into a Power Pivot report.
If we drag date column from transaction table into a report, instead of this dimension the hierarchy will be displayed. This kind of display can be useful, but there are situations when it will disturb us.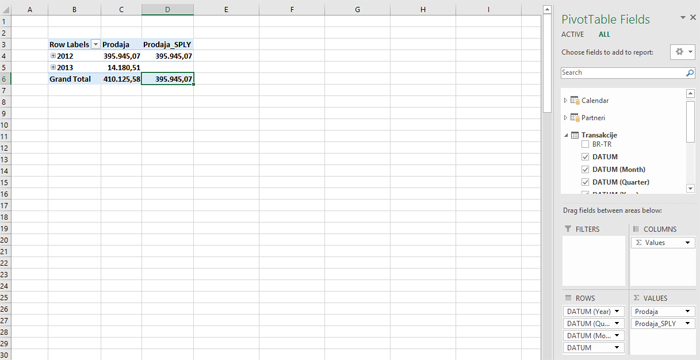
To disable this option, activate Excel options (File/Options) and in the Advanced tab find a group of options marked as Data. Here, select the Disable automatic grouping of Date / Time columns in Pivot tables. Once you confirm the selection, every next time you want to drag the date column into Rows or Columns area, dates will be displayed instead of the hierarchy.
