Cash flow plan
Many companies that have excellent sales results are bankrupt because they do not have enough cash! Therefore, it is necessary to plan and monitor cash flows. This is not always easy, but with an experienced accountant and defined contracts with buyers and suppliers, it is possible to create a plan that allows us to track inflows and cash outflows and, based on this, we can have a better insight into the business.
In the following example we will analyze the company that has a very simple business. This is a micro company that deals with reselling toner cartridges. It buys them all from one vendor, with a payment period of one month, and sells it to one customer who pays in advance. The initial balance on January 1’s account is € 2000.
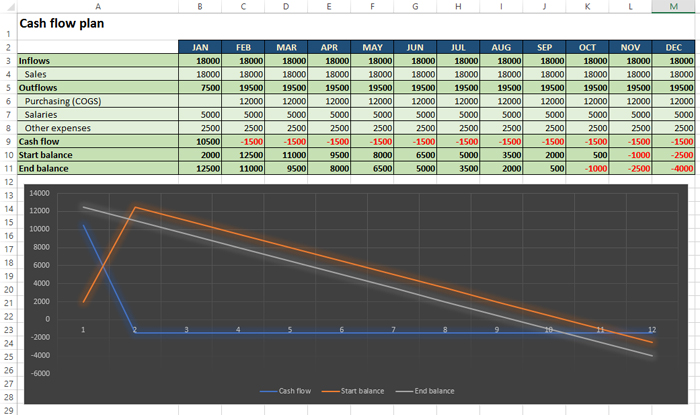
We will create a table with one descriptive column and 12 columns representing the months of the year. In rows we enter data, where we will first enter the inflows (revenues) and then outflows (costs). The upper row represents the sum of the inflows or the sum of the outflows. Finally we add three more rows: cash flow, initial balance and end balance.
Cash flow is calculated as the difference between the inflow and the outflow in the current month. The start balance in the first month is the account balance. In each of the following, this is the last state of the previous month. The final balance is the sum of the cash flow and the start balance.
When we fill this table, we can easily notice in which months the company will not be liquid. In our case, it procures toner at a price of € 12,000, and sells them with margin of 50% at a price of € 18,000. As you can see, it’s not enough to cover the costs. Cash flow is positive only in the first month, since then there are no obligations to the vendor. In all other months it is negative. The start balance is constantly decreasing, and in the last three months it is evident that the company operates with a loss due to a negative end balance.
In order to make the data even more noticeable, it is recommended that with the help of conditional formatting technique mark all the cells with negative values in red. You can also create a simple chart that will display all indicated values.