
ArcGIS maps
Vector maps were always better than raster for better quality and more precise location display. Power BI since recently supports ArcGIS maps, based on Esri’s geographic information system, which in addition to common functionality of maps offers the ability to use some profound options and display statistics. The text that follows will be about the basic features of this visual.
As a data source for demonstrating work with ArcGIS visual I chose a simple table with the names and capitals of the US states, where one column containing quantites sold is added. By clicking on the icon that resembles a globe we add visual into the report. Similarly as we did with traditional maps, we define the location by dragging the place (Capital) in the Location field. Further Quantities are coated into the Size field.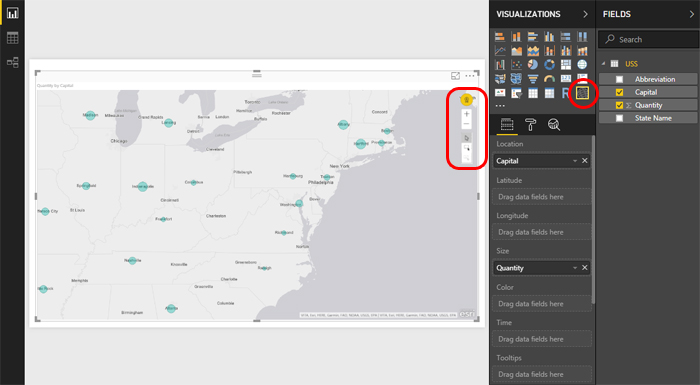
On the right side of the visual there are several controls. First of all, there’s a login button. By logging into the system user should get some additional features. Then there are the zoom controls of the folder, represented by the buttons marked as “+” and “-“, and then the buttons to choose whether we are selecting a single object, multiple objects, or the whole country.
Additional map settings are accessed after the context menu is displayed, which we open by clicking on the icon marked with “…”, and further by selecting the option Edit. After this action, you will see an enlarged map in which, on the top, there is a menu with multiple options. Basemap and Map Theme are options by which we adjust the way the map is displayed. Location Type contains options by which we can specify where the geographic objects we are viewing are, and Symbol Style contains options for detailed formatting of objects displayed on a map. The Pins option can be used to search the map, and Drive time calculates time needed to travel between two marked locations.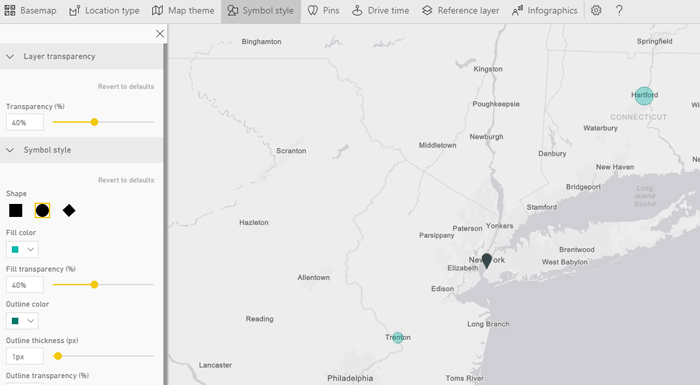
Infographics allows you to add statistics to a map. After this option is activated, to the left panel, in the Demographics tab, a menu will appear that offers a selection of numerous statistics. Choosing some of them adds a window on the right that displays information about the selected location, e.g. number of inhabitants in the given radius in relation to the selection. By clicking on the Settings tab there are options that allow you to change the radius.
Reference Layer allows you to set an extra layer on a map that shows the results of a survey. For example. the average income of households in the US measured in 2016. By selecting this layer, all US states will be colored in relation to the measured amount of income.
Adding an ArcGIS maps into the report will significantly improve precision of data shown. Unfortunately, the above options can only be applied for locations within the U.S.A.