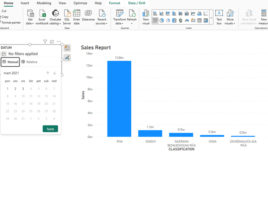
Power BI Dataflows

Dataflows are a feature within Power BI which is used to connect and transform data to utilize them as datasets when designing reports. It is a good way to create reusable datasets that are refreshed each time when a change occurs. They can be used by different users within a company to create reports not only in Power BI, but also in other Power Platform services.

Power BI metrics

Metrics is a functionality that allows you to monitor various indicators within the Power BI service: goals, tasks, ratio numbers, KPIs… Planned and realized metrics can be entered manually, retrieved from reports or linked to some other indicator. Also, data on planned and realized metrics can be pulled down to Power BI Desktop using the new slicer, which enables easier monitoring and coordination between management, executors and report designers.

Report parameters

Report parameters are a new Power BI Desktop feature that allows you to create dynamic slicers with which you can influence the appearance of the report. In the previous “recipe”, you could see how it looks when we create field parameters, and now you will find out how to make those that contain numerical values. We will create a parameter that describes the sales target, then we will change it and see how it affects the chart…

Dynamic slicers

Slicers are visuals, graphic objects that enable filtering of pages or entire reports. They usually have fixed values. By introducing Power BI report parameters, when parameterizing according to fields, it is possible to set dynamic slicers which we can use to display visuals with different content. For example we can choose whether should track sales by manufacturer, brand, classification or sales group…

Conditional formatting of data labels

Data labels in charts are always useful because they implicitly show us the value of the series, without the need to look at the axis. However, in traditional charts, they are always formatted the same way; they are displayed in the same font size and style, the same color… Power BI Desktop recently got the option of conditional formatting of these values, which makes the reports much more vivid.