Conditional formatting with DAX
When you define conditional formatting within a visual, there are several options available to you. You can apply a color gradient that formats the display from the lowest to the highest value, define formatting rules based on specified conditions, or use your own DAX formula to specify formatting conditions. In this article, you’ll learn how to apply conditional formatting by using DAX to achieve greater flexibility and control over how your report looks.
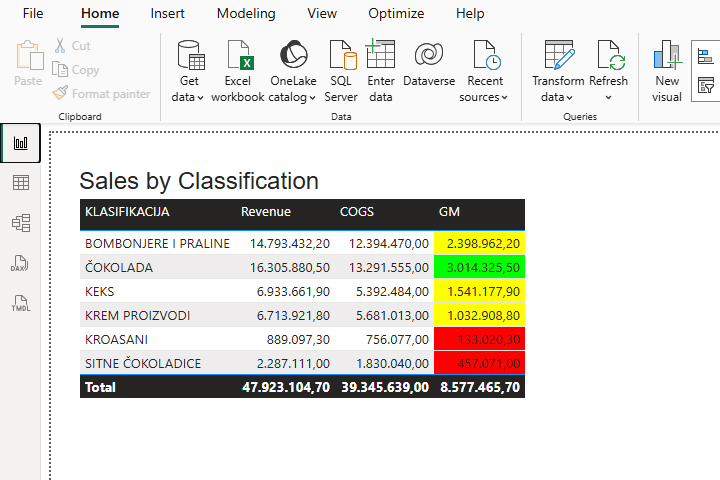
We added and connected the appropriate tables to the model, and then based on them created a visual table that shows revenues, expenses and gross margin according to classifications. How do we, with the help of our own DAX formula, color the background of the cells in the GM column depending on the defined conditions?
First, let’s create a measure that determines how to format depending on the value.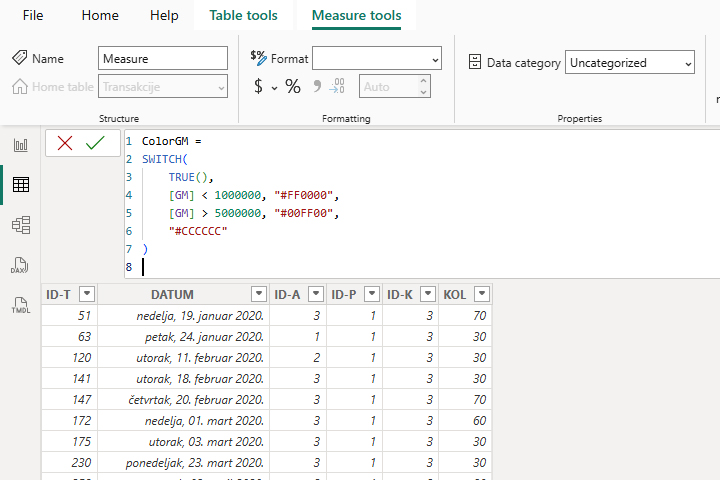
In this way, in the GM column, we will apply red color if the gross margin is less than 1 million, and green if it is more than 5 million. For all other values, we use the default gray color.
Hover over the GM report dimension in the Build menu, and then right-click to open the context menu. Let’s choose Conditional Formatting/Backgroud color.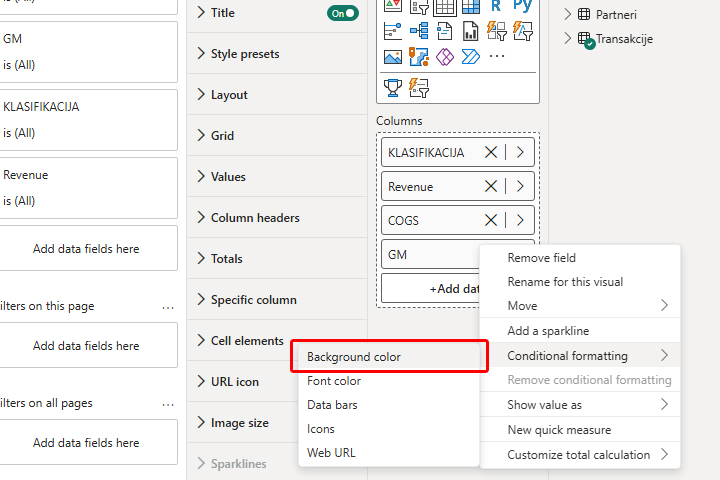
In the Format Style drop-down list, select the Field Value, and then select the previously created ColorGM measure.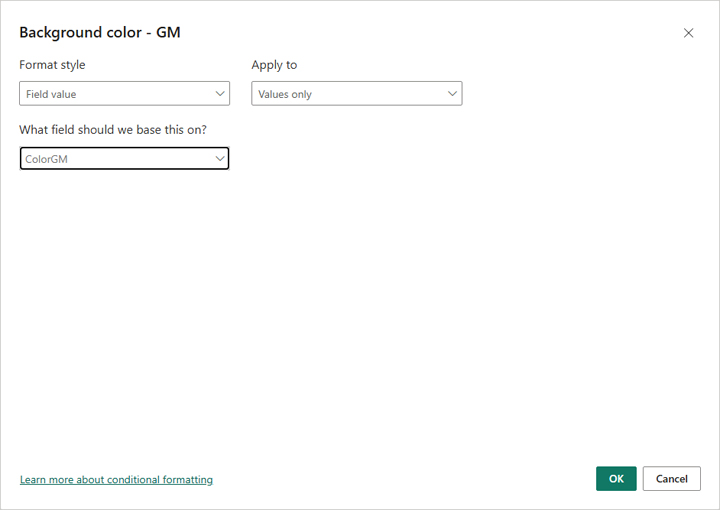
When you confirm the entry, you will see that the background color in the GM column will change depending on the value.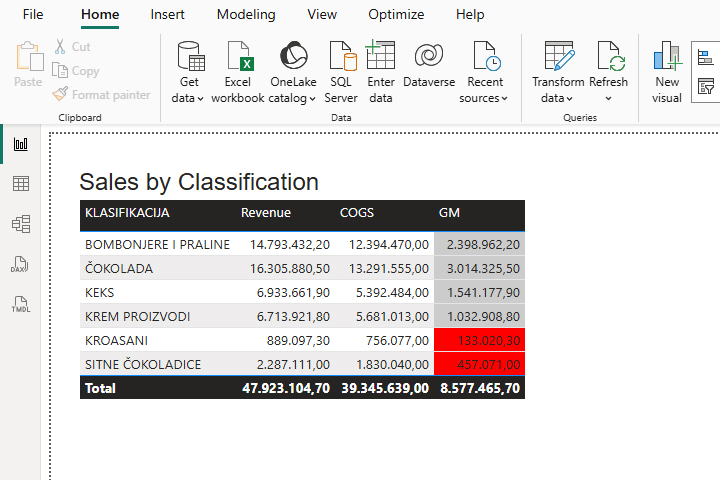
If we decide to change the formula to the ColorGM measure, and reduce the upper limit from 5 million to 3 million, and indicate yellow as the default value…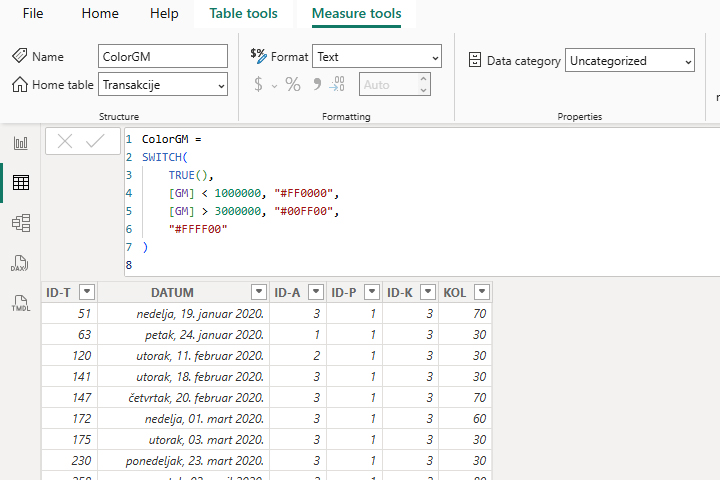
As soon as we confirm the change to the measure, the previous visualization will be formatted according to the newly defined rules.