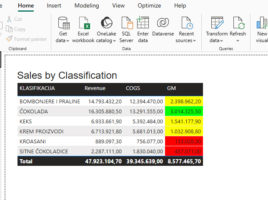
Conditional formatting with DAX

When you define conditional formatting within a visual, there are several options available to you. You can apply a color gradient that formats the display from the lowest to the highest value, define formatting rules based on specified conditions, or use your own DAX formula to specify formatting conditions. In this article, you’ll learn how to apply conditional formatting by using DAX to achieve greater flexibility and control over how your report looks.

Microsoft Copilot & quick measures

Microsoft Copilot is a chatbot, based on ChatGPT, and is integrated within many Microsoft services and applications. If you use it in Power BI Desktop reporting platform, it enables you to create quick measures and to generate DAX statements based on natural language. With Microsoft Copilot, creating measures has become much simpler, and you will find out how it is used in the “recipe” that follows.

Visual Calculations

If you want to present a report based on data, you will do so by connecting to the source, purifying, modeling it and then adding appropriate visualizations. As part of the modeling process, we often created measures and calculated columns by writing DAX statements. In a similar way, we were able to add Quick Measures. Now there is an even easier way, and that is to create calculations within a visual…

Calculation Groups

Calculation groups is a new option within the Power BI Desktop application that allows us to implement DAX calculation groups within the data model. They serve to simplify calculations when we use similar DAX expressions, where only the variable (expression) that appears in them varies. By adding them, the model is automatically optimized by removing implicit measures.

DAX Query view

When making reports, users often create measures using complex DAX expressions. Because of this, they often use some external tools to prepare and analyze the created measures. For this reason, the Power BI development team added, in addition to the three existing ones, one more view within the Power BI Desktop application. It enables the creation and analysis of complex DAX measures.