Same thing last year

Time Intelligence functions are often used for reviewing implementation of the goals at the same time last year. In what follows we will mention a few of DAX functions that cover this area. First, there is a function SAMEPERIODLASTYEAR which should monitor business results in the same period last year. And then there are functions DATEADD and PARALLELPERIOD by which we can monitor the achievement of objectives in the previous or next period (month, quarter, or year) in relation to the current data.

Previous and subsequent periods

If we want to carry out calculations in previous or the next period in relation to the current date, should use “PREVIOUS” and “NEXT” Time Intelligence function. They allow aggregation of data, usually the column that contains the quantity or amount of sales, compared to the previous year, quarter, month or day, as well as in relation to the next year, quarter, month or day. In the example below you will see how to utilize this class of DAX functions.

Time Intelligence DAX functions

DAX has a variety of functions for working with date and time which do not differ much from similar traditional Excel functions. Time Intelligence functions, on the other hand, are a special group of DAX functions that enable calculations in accordance with time periods: years, quarters, months and days. These periods are used as special filters that allow achieving of the results that we quite hardly get by using traditional calculation methods.

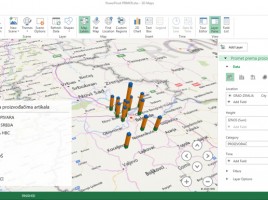
3D maps

3D Maps (PowerMaps) is tool for graphical representation of data in relation to geographical locations on a 3D model of the planet Earth. It is an Excel add-in that is of version 2016 became an integral part application. Based on location data from the Model Excel is connected with Bing maps and finds geographical coordinates on which to draw map charts for given reporting dimensions, such as turnover (sales) or price difference …

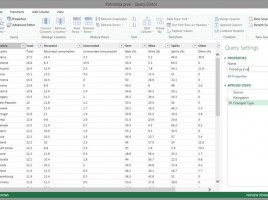
Query Editor

When you use Power Query to retrieve data often need to be “purified” before they can continue to be used in the reports. For this purpose you can use a tool called Query Editor. It opens in a separate window, just like Data model, with its own ribbon menus that have a multitude of options for data processing. The following text will be talking about some basic options that allow transformation of data.