Power Query

Power Query is an Excel add-in that is used to retrieve data from various sources, connecting to them and purging data before we use them to create a report. It manipulates data in a worksheet, managed within structured table, and allows directly adding them the model. First release of Power Query was an optional add-in for Excel. In version 2016 it has become an integral part of the application. This technology is embedded in PowerBI service.

KPI

KPI (Key Performance Indicator) is the most common factor that shows the success of the company in any sphere of business, such as financial performance, customer confidence, employee satisfaction, process management … In Power Pivot reports KPI is obtained by comparing the existing measures with a goal value or another measure. When dragged in the report KPI is presented as a value, goal or status indicator (traffic light) showing whether the target is exceeded, realized or unrealized.

Functions EARLIER and EARLIEST

Formula in calculated column will be evaluated using the row context, which means that all columns that are referenced give results in a row in which the formula is located. Evaluation continues for each subsequent row, so that by the end of the table. Since calculating final sum takes place iteratively we can hardly see what happened in the previous row as you would do in traditional Excel formulas. Here come into play EARLIER and EARLIEST functions.

Maps in Power View reports

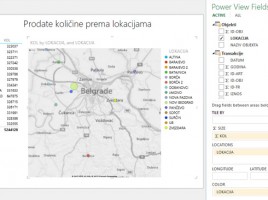
If Data model contains some universal geographic information (name of city, region, country, etc.) we can use them to create a chart within Power View. It enables creating maps based on Bing maps, after it automatically turns on the mechanism for searching and comparing geographical data from the model with the database of geographical locations. Maps are part of Power View reports ecosystem and they make a great supplement to the reporting panel.

Power View

This is a tool for creating homonymous graphical reports, built on of Microsoft Silverlight technology, and based on data from the Model. It allows creating rich graphical reports that show tabular data, charts, time-oriented charts, maps… Interconnection of its elements makes it an effective tool for making dashboards, and can be used for creating similar SharePoint reports.