Editing report elements

Since March 2018, PowerBI Desktop has several new options for viewing and editing reports. First, there is an option to highlight one visual in relation to others, which is in its context menu. And then, there are a few more options that allow you to capture your favorite report views, view and manage objects in a report, lock objects, show field properties, and a set way to synchronize slicers…

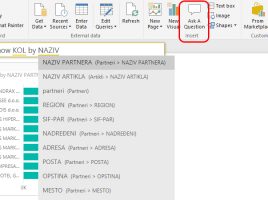
Asking questions

Power BI users have long been able to, by entering a question in a specially specified field, create a report that, by combining the reporting dimensions and measures, answers the question asked. Recently this option has been enabled in the Power BI Desktop application. Home ribbon now, besides the usual „New Visual“ option, also contains „Ask a question“. Let’s see how it’s used!

Options for document recovery

PowerBI Desktop is an ever-evolving application. Although rarely, it may happen that it freezes, so you need to “kill” it by entering Task Manager, by pressing the CTRL + ALT + DEL key combination and exiting the active process. The novelty is that while working in the background, a document is being saved, so if a crash occurs, Power BI Desktop will offer you the option to restore the last version.

Quick Insights

In similar way to the newer versions of Excel PowerBI offers a mechanism that, based on a given dataset, can provide you with visuals, usually the charts that best represent your data. These can be: columns, bars, pie charts … At the same time, along with each one a brief description is provided on the basis of which you can conclude why this visual is proposed. Get ready to know Quick Insights!

Data clustering

When we make PowerBI reports with Scatter chart there is a technique where, by using machine learning mechanisms, data groups are grouped into clusters. Clusters are represented by different colors and in this way it is easier to see the connection between groups of data. Once created clusters can also be used to create other PowerBI visuals.