
Creating Gantt chart
Gantt chart s a chart type used to track project realization through phases, so we can see when the activity starts, how long it takes and when it finishes. It does not exist as a standard chart, but it can be created by modifying the Bar chart. In the following text, step by step, you will be able to find out how to create such report.
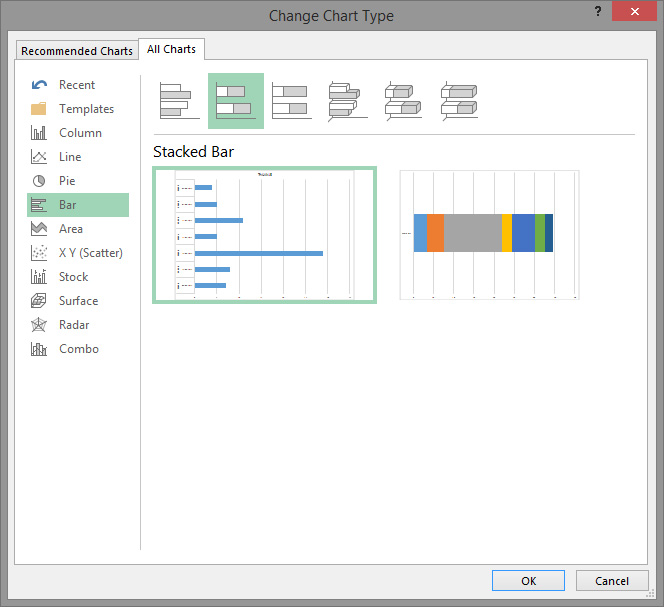
To make a Gantt chart, it is necessary first  to have basic project information. In the table we have entered the project phase names, the start date of each phase, and the duration in days. After selecting the first two columns (PROJECT PHASE, START), press the F11 key and create a new worksheet in which a simple chart will be displayed. Now you need to change the type of chart, which is done by clicking on the Design ribbon and choosing the Change Chart Type option. A dialog box will pop up on the screen and further you should select Bar Chart, subtype Stacked Bar.
Next, you should add a third column which shows project activities duration in days. It can be done in several ways, but the quickest is to select column that contains data, copy (CTRL+C), go to the chart and paste data series (CTRL+V). Duration will be shown as an additional stacked bar.
The chart begins to look like a Gantogram but the phases are shown in the reverse order. To set the first stage to be displayed at the top of the chart, you need to right-click on the phase tags on the vertical axis and choose the Format Axis option. In the menu that will open to the right, select Categories in Reverse Order to change the order of the phase display. Further, it is only necessary to hide the first series of data. We do this by selecting this series and then adjusting it to its color, as well as the color of its frame, to be transparent. We got a Gantt chart! We can further beautify the report by adding title, legend, changing background…
