
Hierarchy of reporting dimensions
When we use Power Pivot reports often happens that we’ll use two or more reporting dimensions, hierarchically arranged, to provide organized access to information. If something like this occurs frequently we can use specific functionality of Power Pivot reports: Hierarchy. Hierarchy is a named set of hierarchically arranged reporting dimensions, and more about ways for creating and using them you’ll find out if you read this recipe.
In order to work with hierarchy you first need open the Data model window. You can do this by selecting Manage in the Power Pivot ribbon. Then we shall select Diagram View. In this case, data model consists of three tables: Artikli (Items), Objekti (Objects) and Transakcije (Transactions). First table contains data on all items, other on the retail stores, and in the third we see the sales of items at retail stores.

To create a hierarchy you need to right-click on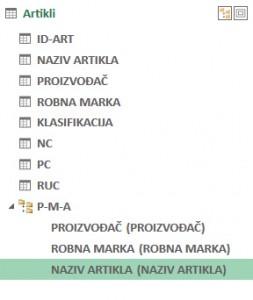 the reporting dimension within Diagram View that will be at its peak. In our case, it’s a field Manufacturer in the table Artikli (Items). We will then select option Create Hierarchy. At the bottom of the table appears an object that resembles a new field in the table, but it is distinguished by a slightly different icon which is associated with a hierarchical view. In this field should specify the name of the Hierarchy. According to names of of the fields we will add in the hierarchy we should name it “P-M-A ‘(Products-Brands-Items). Next, let’s add some dimensions. We will first drag field Marka (Brand) into a previously created hierarchy, and then repeat the process with a field Naziv artikla (Product Name). After we finish the creation process we can change order of dimensions within a hierarchy by simple dragging to the desired position, as they were dimensions within Rows of Pivot table.
When you create a Power Pivot report, will see that the hierarchy named “P-M-A” appears as a field located in the table Artikli (Items). Dragging this field in the Rows area and adding, for example, Sum of Kol (sum of amounts) from the table transactions in the area of Values will get a report on the quantities sold to retail stores ordered by hierarchical view. The hierarchy that we create always adds dimension: manufacturer, brand name and item, in the above order, a report can be expanded or collapsed if we want to show details given by lower hierarchy level filter.
