
MS Fabric Data Warehouses
A data warehouse is a centralized system used to store, integrate, and organize large amounts of data, often from a variety of sources, in order to prepare it for reporting and analysis. Microsoft Fabric offers users to easily create data warehouses within organizational tenant environment from which you can create reports directly in the Power BI service or by using the Power BI Desktop application.
Why do we want to build a data warehouse at all? They are necessary to create a business intelligence solution. In your day-to-day work, for example, when you create reports based on ERP data, you will connect to the transactional database. The larger the database, the more time it takes to load the data into reports. Therefore, someone came up with the idea that it would be a good idea to take only the data that is necessary for reporting from the database, by writing an SQL query, and store it in the same but smaller database – the data warehouse. The process of downloading and transforming data is usually done within the SQL Server Integration service and is called ETL (Extract, Transform, Load). However, with the advent of the Power Query tool, it has completely replaced, just mentioned, the service, and in addition to working locally, it can also work in the cloud, such as Dataflow or Dataflow Gen2. This article will discuss how we can create a data warehouse in a Microsoft Fabric environment, based on a query to a local MS SQL database.
Sign in to Microsoft Fabric. To create a data warehouse, you’ll want to use a workspace other than My Workspace, and have rights defined by the Contributor role or higher. This means that if you are assigned the Viewer role , you will not be able to create a data warehouse, but if you are a Contributor, Member, or Admin, you have the necessary permissions for this task. If you’ve created one before, select that workspace, click New Item, and then select Warehouse. A window will open in which you need to assign a name to the new data store. Let’s call it Analysis.
Once the repository has been created, it needs to be filled with data. For this purpose, it is best to use Dataflow Gen2. Open the Get Data menu, and then launch the New Dataflow Gen2 option.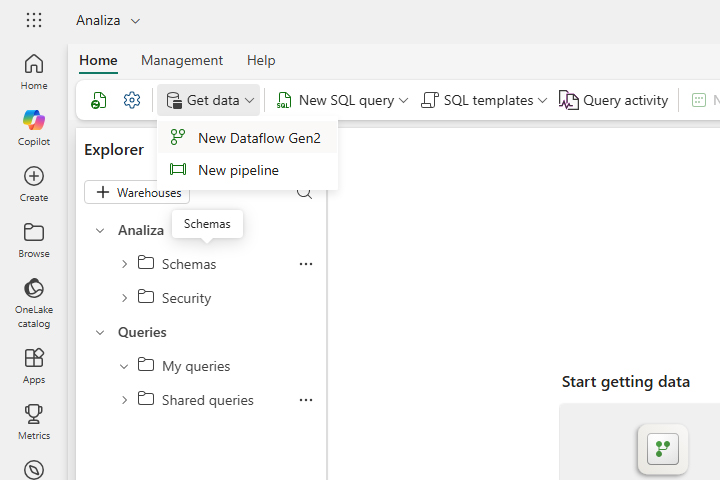
Choose a suitable name and then click on the Create button.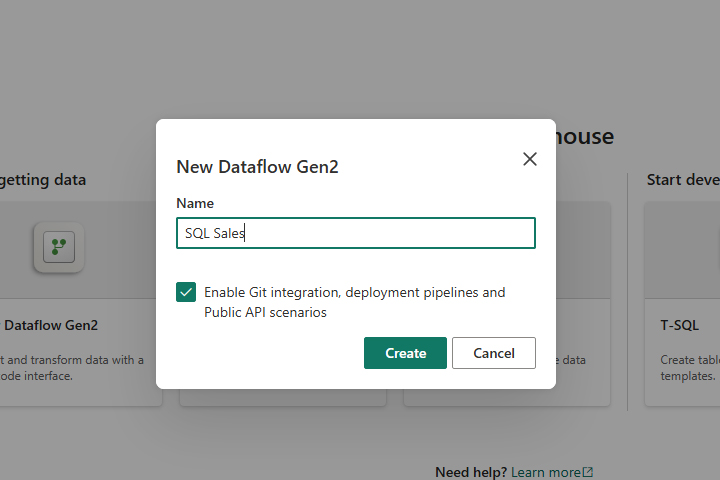
Then, as the data source, we select the database that is within SQL Server. You need to enter the name of the server and the database, and choose the method of login. Also, it would be a good idea to immediately write a query to fill the data warehouse. We will take advantage of the following:
USE Sales
SELECT A.CLASSIFICATION Classification, SUM(T.KOL) Traffic FROM dbo. Transactions T
LEFT JOIN dbo. Articles A
ON T.[ID-A]=A.[ID-A]
GROUP BY A.CLASSIFICATION
ORDER BY A.CLASSIFICATION ASC
Next, click on Next. Before we go any further, it’s important to note that if you’re downloading data from a local database, you’ll need to have a Power BI Data Gateway installed to be able to recognize it.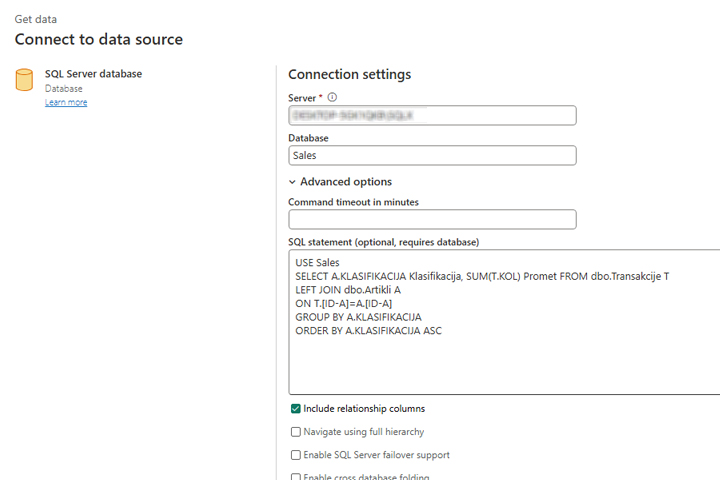
As a result, a table is obtained with grouped quantities sold according to product classifications.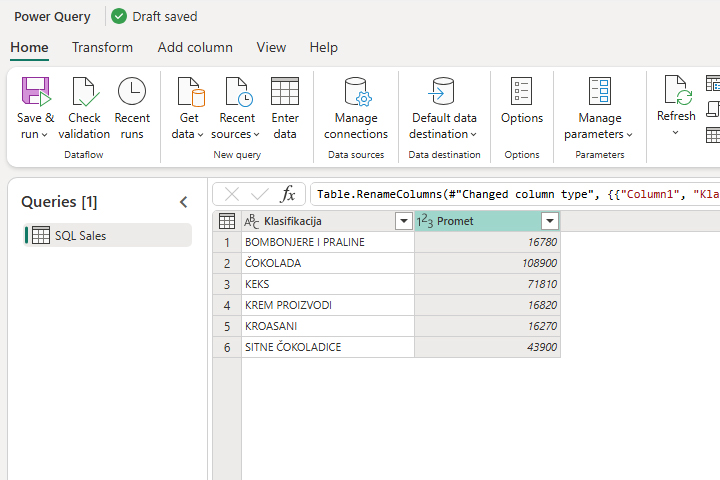
This data can be imported into Power BI Desktop and used to create appropriate reports.