Power View
This is a tool for creating homonymous graphical reports, built on of Microsoft Silverlight technology, and based on data from the Model. It allows creating rich graphical reports that show tabular data, charts, time-oriented charts, maps… Interconnection of its elements makes it an effective tool for making dashboards, and can be used for creating similar SharePoint reports.
Power View is a novelty that is brought by Excel 2013. Just as PowerPivot, in version 2013, it was an optional add-in and it was necessary to turn it on in order to use it. Later, you could have start it from Insert toolbar. Since version 2016 things have changed slightly. It still exists, but now it is necessary to manually add the icon using the option to adjust the ribbon (Customize the Ribbon).
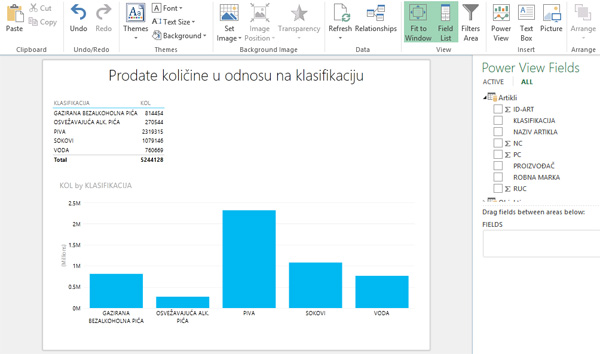
Easiest way to create a report is to select option PowerView from Insert toolbar. Remember, before making such a report, there should be reporting dimensions you need (tables, measures, calculated columns) in the Data model. After a short delay appears blank sheet. On the right side you can see control panel, similar to the one in pivot table. By dragging reporting dimensions you can create a Power View report. Also, there is a panel with data filters.
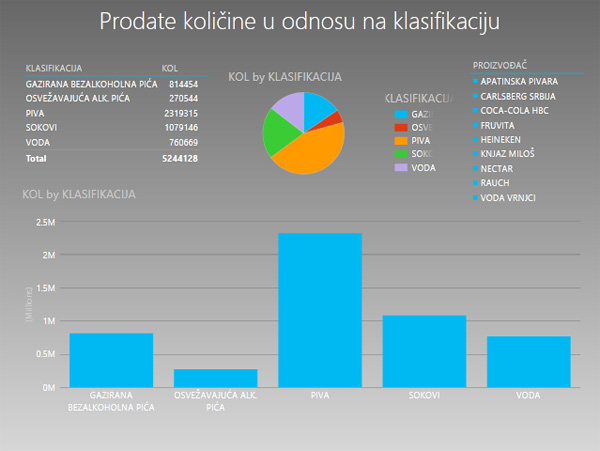
Dragging reporting dimension in Fields is used to create a table. The table is an essential element of Power View reports, and by modifying tables you get all other other reports. To begin with, we have created a table to which we add dimensions KLASIFIKACIJA (Classification) and SUM of KOL (sum of quantities).
We create chart by modifying table. We can create a new one, then modify it, and we can also Copy + Paste an existing one, and then modify it. However you like it! To create a chart you should go to Design ribbon, and further from a group of options Switch Visualization choose the type of chart.
 Charts that appear in the Power View reports have fewer options than traditional Pivot charts and we can not much affect their appearance. However, in the Design toolbar there are several options for their editing. To add elements of the report you can use options in the Layout toolbar, and other useful features can be found in the PowerView toolbar.
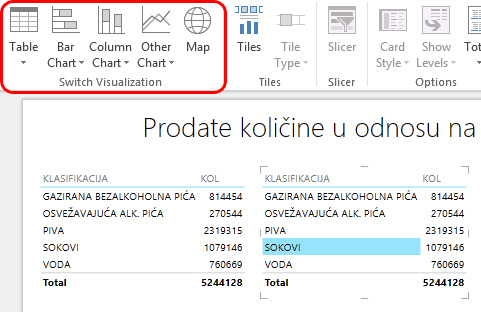
In addition to the charts, in the Power View reports we can use slicers, and there are many other options for changing report’s appearance. Such statements are made very functional, and can be used to create a reporting dashboard used to monitor different aspects of the business.