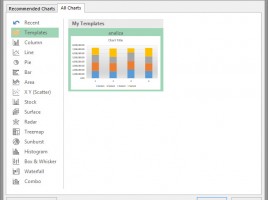
Chart templates

Companies often strive to unify their reports using predefined rules regarding choosing font types, color styles and other formatting modes. The unified look is introduced using Templates, and when we want to create charts, we will use chart templates. In addition to appearance, standard charts also introduce standard data ranges in axes, which contributes to the accuracy of the report.

Charts, in a blink of an eye

The picture says more than 1000 words! Charts are an indispensable part of Excel reports with the goal of graphically displaying data and highlighting business trends. Recently, Excel knows that and, based on the given data, it proposes several types of reports that reflects them in the best way. Also, a user in the All Charts group can see all the offered report types and some of them use to create a new or modify an existing chart.