Analyze Data

A few years ago, Excel, which comes as part of a Microsoft 365 subscription, got the Ideas option. Now this option has been improved and is called Analyze Data. It enables, with the help of artificial intelligence, simple and fast data analysis to generate tables, pivot tables or charts according to user questions, which help user to visualize data in appropriate business reports.

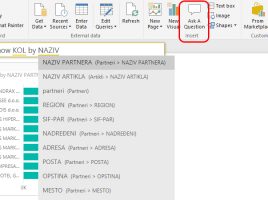
Asking questions

Power BI users have long been able to, by entering a question in a specially specified field, create a report that, by combining the reporting dimensions and measures, answers the question asked. Recently this option has been enabled in the Power BI Desktop application. Home ribbon now, besides the usual „New Visual“ option, also contains „Ask a question“. Let’s see how it’s used!

Power BI reports

In the previous “recipe” was the word on how to import data to PowerBI and I have listed a number of sources from which it can connect. In what follows we will focus on the description of the user interface, and then you will see at practical example how to make reports and add them to dashboards. We will not be focusing on details but I believe you will, after reading this article, be able to independently create PowerBI reports.