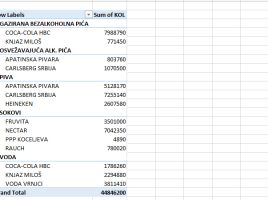
Views on the pivot table

The end of the old and the beginning of the new year is often a reason to look back. I read this post a while ago and it seems that I could have clarified one of the things better. There are many different views on pivot tables, and as Nectar’s advertising slogan says, “It does matter” In this “recipe” we will deal with each of them, after which you can decide for yourself when to apply which view to get a suitable report.

Design of a structured table

After we have created a structured table it would be nice to take some time to change its appearance. Excel has a large number of predefined styles, which allow us to change the way this table is displayed, and there are many other options that can be used to format individual parts of a structured table. Before we start to fill in the data table, let’s make it a better looking!

Appearance of a pivot table

Once we have created a Pivot table we can change the way it looks. Depending on the settings, the Pivot tables can be distinguished, although all those formatting properties that apply to the traditional Excel tables apply to them. By changing the style and displaying individual table elements (totals, subtotals, headers of rows  and columns), we can change the look of the Pivot table in accordance with the reporting needs.