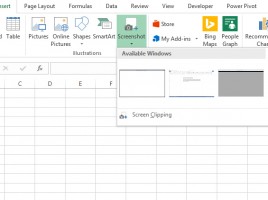
Drawing borders

This is, I must admit, a very fun option and totally different from what you get used to when working with Excel. On the other hand, if you are not skilled in formatting the table framework, it can help you to draw the tables in which you will enter the data. This option has not always been in Excel, so I believe that many experienced users do not know that it exists. Below you will find out more about drawing the framework of the table.

Most important financial statements

“No romance without finance” is part of the lyrics of ’90s hit which point to a major life truth: whatever job you’re doing, sooner or later you are going to review the financial statements. This is inevitable, because the insight into the structure of sources, assets, revenues, expenses and other financial indicators you can learn your position “in space and time ‘, or whether you are doing your job well or not, and where there is room for improvement.

Too many worksheets?

If we choose to create a complex Excel document that combines all the elements of a business process, we will try to call everything nicely, mark it, color it … During this process, we will create multiple worksheets, and sometimes give them long names in order to describe them as accurately as possible. The trouble is that the document can then become overloaded. The goal of this “recipe” is to show you a simple trick to find the desired worksheet faster.

ABC Analysis

ABC analysis is a method used for analysis and management of inventory. Depending on the share in the total value of the stock it distributes items in groups A, B or C. They make up about 70%, about 25% and about 5% of the total, respectively. Since items from Group A account for the largest share of the total value they require frequent and rigorous control. Items from the group B require something smaller, while items from the group C require the least control.

Worksheet background

When we make reports, the goal is for them to be both functional and beautiful. Their background can also contribute to the appearance of the worksheet in a positive way. It is a picture that is placed behind the tables, charts, and other elements of the report. If after hiding it, we also hide lines separating cells (Gridlines) reports will look like they were not created in Excel. But, more importantly, users will be able to easily find the necessary information.