Power BI metrics

Metrics is a functionality that allows you to monitor various indicators within the Power BI service: goals, tasks, ratio numbers, KPIs… Planned and realized metrics can be entered manually, retrieved from reports or linked to some other indicator. Also, data on planned and realized metrics can be pulled down to Power BI Desktop using the new slicer, which enables easier monitoring and coordination between management, executors and report designers.

Power BI alerts

When you create a dashboard within the Power BI service, you may want to be notified if the data reaches a certain predefined value. For this purpose we use Power BI Alerts, and one can only be created for Gauge, Card and KPI visualizations. In the following text you will find out how to use this Power BI service feature.

Traffic lights

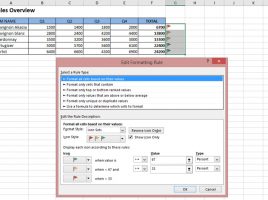
Conditional formatting is an Excel functionality that is often used, and allows you to emphasize certain parts of the report. Typically, conditional formatting is used within the same column, but how do we display “traffic lights“, icons that indicate a change in business, within another column? This is a very simple procedure, and if you want to find out how this is done, you have it in this “recipe”.

KPI

KPI (Key Performance Indicator) is the most common factor that shows the success of the company in any sphere of business, such as financial performance, customer confidence, employee satisfaction, process management … In Power Pivot reports KPI is obtained by comparing the existing measures with a goal value or another measure. When dragged in the report KPI is presented as a value, goal or status indicator (traffic light) showing whether the target is exceeded, realized or unrealized.