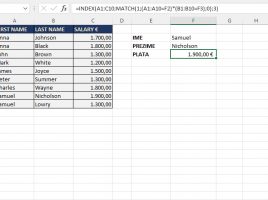
Multiple criteria MATCH

Sometimes, when working on business reports, there is a need to create a formula that contains several criteria for searching a range. When we have only one criterion, it is enough to use a combination of INDEX and MATCH functions. When there are more of them, it is already a bit more complicated situation. However, this is not too complicated either, you will see in the “recipe” that follows…

Simpler analysis

In the “recipe” Simple sales analysis, you could learn how to get to the value that is in the intersection of the row and column of the sales report. On that occasion, we used the INDEX and MATCH functions. The new XLOOKUP function allows this analysis to be performed in a much simpler way, by combining two instances of this function. Let’s see how it’s done!

Differences between tables

In your day-to-day work, many of you copy data from a company’s business information system or some spreadsheet where they are exported to create the necessary reports. The problem arises when the data changes. How to trace where the change occurred? What is the difference between a source and a derived table? In the text that follows, you will see how to use the INDEX and MATCH functions, as well as the conditional formatting technique, to highlight the differences between the tables.

XMATCH function

The XMATCH function is a more modern version of the MATCH function, and is used to search arrays, by row or column, to find the position of a given value. It supports accurate and approximate comparisons, and wildcard characters can be used as a substitute for one (?) or more characters (*) during search. This is another of the new dynamic array features that is available exclusively to Office 365 subscribers as of February this year.

Simple sales analysis

By combining INDEX and MATCH, we can easily calculate sales results if the data we analyse is given in a table that is a matrix. By using Data Validation for certain cells you’ll get a very simple sales analysis tool that is easily scalable and can be used in more complex scenarios. Pivot tables are an irreplaceable tool but there are situations where we get similar results by a different procedure, this is one of them!