SVG maps

The introduction of the SVG format in Excel has gone unnoticed by most users, and it enables the conversion of maps into standard graphics objects. After that, you can do whatever you want with them. In this simple “recipe”, I’ll show you how to convert and format SVG maps you have previously downloaded, in order to create effective reports…

Adding images

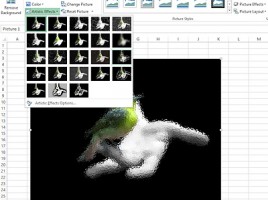
There is a saying that “the picture speaks more than 1000 words”. By adding images, reports seem to look more beautiful and striking, and since 2007, Excel has several advanced image processing options. It is possible to change the contrast and brightness of the image, make it sharper or blurry, change colors … Also, we offer a number of filters that can change the image’s appearance in a similar way as we would do in some professional graphics design software.