Data model

Data model is used to add and connect tables in a whole, in order to retrieve the data needed for reporting. This is a pseudo-base, part of Excel document. By adding a table into the Model data are automatically compressed; later, when we need them for reporting, they are decompressed and used as a reporting dimension in the pivot table. Data model is basis for use of “Power” technologies, i.e. “self-service” business intelligence tools.

How strong is our competition?

When making Marketing Plan one of the activities being carried out is the analysis of competition. How strong is our competition? There are several ways to find this out, and this is perhaps most easily accomplished by tracking revenue and profit of competitors over several years. The following text will show you several Excel charts which should show where is our company and where are competitors on the market.

Decorating the Christmas tree

There is a time of Christmas holidays, the time when everybody, more or less, decorates the Christmas tree, and this served as an inspiration for the text on the application of one more type of Excel chart. It is a subtype of the Scatter called Bubble and by which we can get a “XY” chart whereby a multicolored “balls” are found on the section. To create this diagram all we need are: a table of data, a picture of the Christmas tree and a little work in Excel!

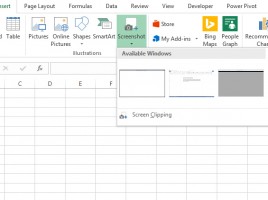
Creating screenshots

Each one of you, who was in the situation of writing a user manual, certainly used one of the options for capturing screen content. To remind you, by pressing the PrtScr or SHIFT + PrtScr (shortcut from the Print Screen) key, the full screen image is transferred to the computer’s memory. Pressing Alt + PrtScr camptures only the contents of the active window. Some recent versions of Excel have an option that allows you to capture screen content.

Worksheet background

When we make reports, the goal is for them to be both functional and beautiful. Their background can also contribute to the appearance of the worksheet in a positive way. It is a picture that is placed behind the tables, charts, and other elements of the report. If after hiding it, we also hide lines separating cells (Gridlines) reports will look like they were not created in Excel. But, more importantly, users will be able to easily find the necessary information.