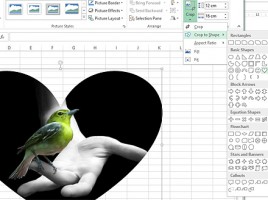
Cropping images

Once we have added an image to Excel, we will often change its dimensions immediately, which can be done manually or by setting the height and width. It happens that the added image contains some unnecessary details. In that case, we are cropping the image to highlight only those parts of the image that we want to see in the worksheet. In addition to simple cropping, Excel also offers several advanced options for cropping images (fitting into a desired frame) …

Adding images

There is a saying that “the picture speaks more than 1000 words”. By adding images, reports seem to look more beautiful and striking, and since 2007, Excel has several advanced image processing options. It is possible to change the contrast and brightness of the image, make it sharper or blurry, change colors … Also, we offer a number of filters that can change the image’s appearance in a similar way as we would do in some professional graphics design software.

Chart templates

Companies often strive to unify their reports using predefined rules regarding choosing font types, color styles and other formatting modes. The unified look is introduced using Templates, and when we want to create charts, we will use chart templates. In addition to appearance, standard charts also introduce standard data ranges in axes, which contributes to the accuracy of the report.

Design of a structured table

After we have created a structured table it would be nice to take some time to change its appearance. Excel has a large number of predefined styles, which allow us to change the way this table is displayed, and there are many other options that can be used to format individual parts of a structured table. Before we start to fill in the data table, let’s make it a better looking!

Pivot charts

Pivot charts have almost all properties as standard charts that are used to visualize reporting data. They are specific in that they are always in relation to the Pivot table on the basis of which they were created or by some other data source (Data Model). Changing data in the Pivot table, e.g. by adding a new report dimension, the Pivot chart is automatically updated. You can find out more about Pivot Charts in the text that follows …