Creating Pivot tables

Pivot tables (Pivot table reports) are a tool for creating interactive reports based on the range of selected data or structured tables. Columns from source tables are used as reporting dimensions by aggregation of data (measures) or using them to analyze in rows, columns, as filters (dimensions) … Once made, the Pivot tables are easily changed by adding or removing dimensions, giving us more different look at the unique original dataset.

Structured tables

All the tables we make have some structure. However, in order to connect with external data sources, Excel requires the structure of the table to be strictly formal. The structured table (Table) represents the named range with a clearly defined header and an applied autofilter. In addition to facilitating connection with other data sources, structured tables allow easy addition of new columns and formulas based on their names …

Calculating subtotals

When making extensive reports, there is often a need to calculate subtotals by reporting categories. Subtotals are, most of the time, sums and they might also be an average, a minimum, a maximum, a product, or a count of articles within a report. Subtotals can be made manually and in this „recipe“ it will be about how to use Excel for automatically adding subtotals.

Grouping of rows and columns

When we work with large tables containing the subtotals according to categories (article classification, sales program, type of partner, etc.), we can perform a grouping by to one of the given criteria. Grouping can be done by rows or columns, and the goal is to make the report more transparent. That is, if necessary, we can display or hide the analytical elements of the report in order for the data to take up less space.

Data consolidation

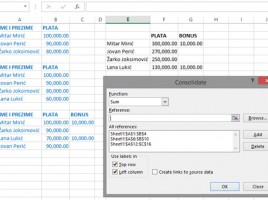
Consolidation is the term that denotes the unification of several parts into a single entity. In practice, we use consolidation when we want to receive a summary report; for example, when we want to summarize the sale by months, quarters, years … The simplest way to do this is by summarizing the data entered in several worksheets in the last sheet using the formula. But what if the data in the worksheets is not uniform? Excel also has a solution for this scenario …