Enhance PowerBI reports

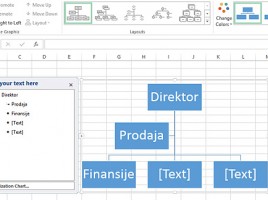
Programmers usually don’t care too much for report’s look, whilst those who watch the reports equally care for their clarity and appearance (correctness is assumed). PowerBI possesses several tools that can be used for enhancing reports. In my opinion it can still be much better. Nevertheless, from version to version PowerBI development team is adding new functionalities and now it is quite better comparing its beginning.

SmartArt

Flowchart diagrams can be made manually, by embedding and connecting different shapes. Also, we can make them based on some of the templates that come with Excel, and it belongs to the SmartArt schema group. SmartArt schemes are nothing more than diagram templates, created by creating and grouping objects. If you are well acquainted with them, they can greatly facilitate your work and shorten the time when making a diagram.

Arranging objects

When we use Excel to create a diagram, we add a few shapes that we later link with arrows to illustrate the flow of the process. All graphic objects can be aligned manually, by dragging them and matching the position with respect to another object. However, all this can be done much easier with the object editing options, where we can still position, group, ungroup objects …

Adding shapes

Excel has a large number of shapes (rectangles, ellipses, arrows, triangles, etc.) held into groups that we can use to illustrate a flowchart, process, hierarchy, organizational scheme … Excel can significantly replace Visio, whose purpose is to draw various diagrams, and allow us to display them in the report, and the text that follows will describe the ways they are added and edited.