Time Intelligence DAX functions
DAX has a variety of functions for working with date and time which do not differ much from similar traditional Excel functions. Time Intelligence functions, on the other hand, are a special group of DAX functions that enable calculations in accordance with time periods: years, quarters, months and days. These periods are used as special filters that allow achieving of the results that we quite hardly get by using traditional calculation methods.
Before we show a few simple Time Intelligence functions you should know that they can not run without the “Calendar” table. To be more precise, for creating reports that exploit these functions you should have at least two connected tables within a Model: one that contains data (transactions) and other that contains all dates that appear in the time period covered. In earlier versions, it was necessary to manually make such a table, and then add it to the Data model. Excel 2016 allows the automatic creation of “Calendar” table.
Again we will use the example that contains data about sales of retail chain. We added the three tables to the Model: Artikli (Items), Lokacije (Locations) and Transakcije (Transactions). To create Calendar Table should go to Design ribbon, open menu Date Table and choose New.

This action will automatically generate a new table in Model named Calendar. Now it is only necessary to connect it to table Transactions. To do so should choose Diagram View, drag DATE column from Calendar table to appropriate date field in table Transakcije. In this case, it is a column named DATUM.

If we switch back to Grid View should be able to see columns that Excel have automatically generated in Calendar table. As I previously mentioned we could have added Calendar table manually (created a structured table with dates and then added it to the Model). In that case it is only necessary to mark it as date table. To do so go to Design ribbon and then, from homonymous menu, choose Mark as Date Table.

Time Intelligence functions are often used in combination with CALCULATE function. Now I’ll demonstrate a simple function that has a goal to filter aggregated data in period between two given dates. Its name is DATESBETWEEN, and its syntax is:
DATESBETWEEN(<date column>,<start date><end date>)
Further, if we want to calculate sum of quantities sold in year 2015 should write an expression:
Prodaja2015:=
CALCULATE(SUM(Transakcije[KOL]),DATESBETWEEN(‘Calendar'[Date],”1/1/2015″,”31/12/2015″))
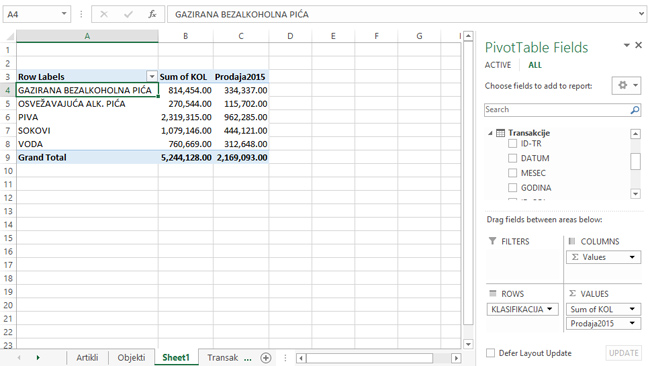
If we create Power Pivot report, and then in Rows drag dimension KLASIFIKACIJA (CLASSIFICATION), in Values SUM of KOL and measure Prodaja2015 (sales in year 2015) should get a report with two columns. First shows total sales, and second only sales in year 2015 (between two given dates).

DAX also has similar function named DATESINPERIOD. It filters aggregated expression in given number of intervals according to the date. Its syntax is:
DATESINPERIOD (<date column>,<date>,<number of periods>,<period name>)
