From start to finish
DAX has lots of useful Time Intelligence functions and in this recipe I will pay some attention to these that filter aggregations according to beginning or the end of a period. My friends from ASEE would say: “From the cradle to the grave is the most beautiful is go-go phase”. However, in this recipe I would hold to quantitative results, and DAX helps us to determine them in the easy way (that’s my field of expertise)!
As recently, in this post we’ll be using example that tracks results of a retail chain business in a certain time period. In the Data model we have added and connected tables Artikli (Items), Lokacije (Locations) and Transakcije (Transactions). Also we created Calendar table and connected it to table Transakcije. First, let’s create a measure that represents turnover (sum of all quantities) within table Transakcije:
Promet:=SUM(Transakcije[KOL])
Turnover on the very beginning of a period is determined by using functions:
OPENINGBALANCEMONTH (<expression>,<date column>)
OPENINGBALANCEQUARTER (<expression>,<date column>)
OPENINGBALANCEYEAR (<expression>,<date column>)
Turnover on the end of a period is determined by using functions:
CLOSINGBALANCEMONTH (<expression>,<date column>)
CLOSINGBALANCEQUARTER (<expression>,<date column>)
CLOSINGBALANCEYEAR (<expression>,<date column>)
Accordingly, we can create measures:
PrometOBM:=OPENINGBALANCEMONTH([Promet],’Calendar'[Date])
PrometCBM:=CLOSINGBALANCEMONTH([Promet],’Calendar'[Date])
Now, if we make a Power Pivot report, drag dimensions MONTH and YEAR in Rows, and measures Promet, PrometOBM and PrometCBM in Values result is a report that follows:
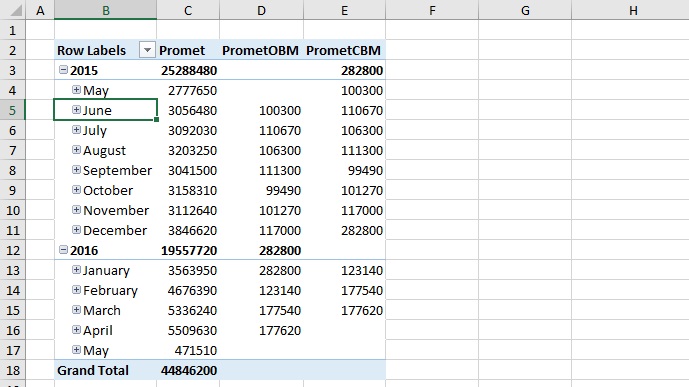
First column shows turnover, second turnover at the first day in a month and third turnover at last day of a month.
The functions we have just described work independently from CALCULATE. If you need similar functions, to be used as filters, these functions are the solution:
STARTOFMONTH (<date column>)
STARTOFQUARTER (<date column>)
STARTOFYEAR (<date column>)
or
ENDOFMONTH (<date column>)
ENDOFQUARTER (<date column>)
ENDOFYEAR (<date column>)
By using these functions we can create measures:
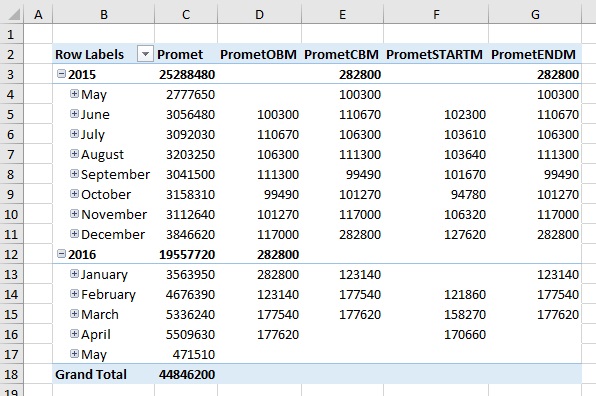
PrometSTARTM:=CALCULATE([Promet],STARTOFMONTH(‘Calendar'[Date]))
PrometENDM:=CALCULATE([Promet],ENDOFMONTH(‘Calendar'[Date]))
By dragging them into Power Pivot report we’ll get the same report as previously shown in this recipe.