Chart analytics
Right below the menu with visualization tools there is a set of three icons that allows us to enter one of the three menus that will be shown at the bottom of this panel. They are called Fields, Formats, and Analytics. First shows all the fields that affect appearance of a visual, second has options for its formatting and the third contains functionalities by which we can improve the chart: trend line, constant, minimum, maximum, average and forecast …
Since we’re dealing with functionalities of Analytics menu I will use an example that holds data about sales in group of retail objects. I created Line Chart which has transaction dates shown on bottom axe and shows values of quantities sold over certain time period.
How do we perform the analysis of the data shown in the chart? The first way is to add a trend line. We’ll open Analytics menu, by clicking on the icon that resembles magnifying glass, open the Trend Line menu and click the Add button. PowerBI Desktop automatically adds a trend line, and with additional options in this submenu we can format its appearance: change colour, style, transparency, and adjust some other options that affect its appearance. At the top of menu is shown the name of trend line. In this field, we can change its name, and right from this box there is an icon marked with “x”. By clicking on it we can remove the trend line. If we’ve changed its appearance and not happy about it, clicking the Revert to Default button at the bottom of the menu will return formatting settings to the default values.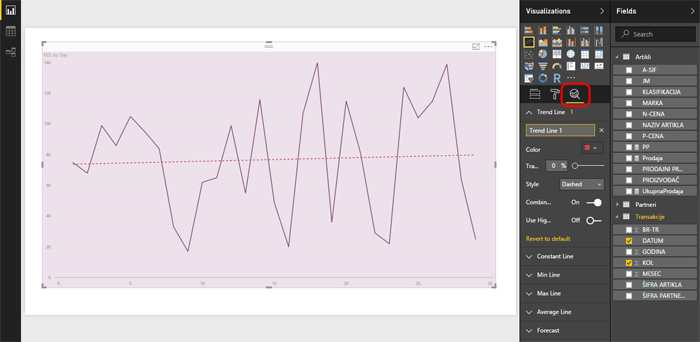
Similarly, we can add minimum (Min Line), maximum (Max Line), average (Average Line) and a constant ( Constant Line). The first three are created on the basis of the least, largest, and average value of the quantities shown in the graph. The line of constants is an arbitrary value that we manually add and may be useful for the analysis of the report.
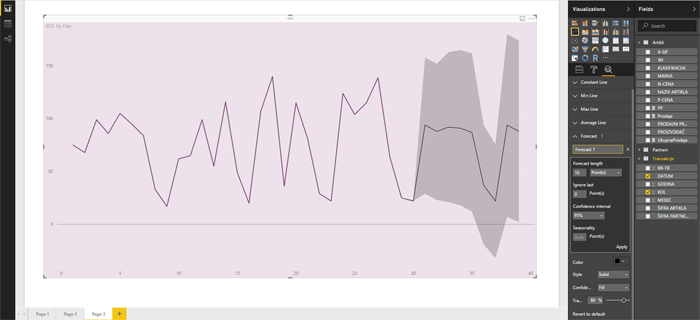
Of all the analytics probably the most useful is forecast (Forecast Line). Based on the given set of values it shows an approximation that represents the prognosis of future trends. For given number of periods, interval of confidence and the seasonality it shows adequate prediction.