Group By option
Power Query has features that allow you to group and aggregate data in a similar way as when writing T-SQL structures, without writing a single line of code. Therefore, the process is much faster and easier. Grouping can be done by one or more report dimensions, and the order is determined in a similar manner as when sorting. Also, multiple data aggregation functions are supported as well as possibility of multiple aggregation…
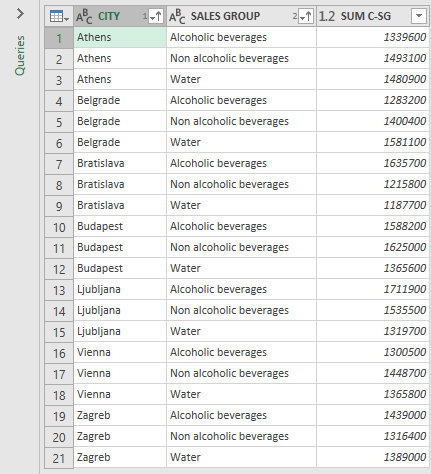
We will import a simple table containing 2000 rows into Power Query Editor that has three columns: CITY, SALES GROUP and SALES. To group them, select the Group By option found in the Transform ribbon. After launching this option, a dialog box will open in which we first select Basic or Advanced. The first indicates that we perform operations on only one column and the second that we want to group multiple columns. If we had selected multiple columns before running this feature, the window with the Advanced option would automatically open.
Let’s start by selecting only the CITY column, which we will do by choosing the name of this column in the Group By list. New Column Name is the title of the column in which data is aggregated. Then, in the Operation list, we select a function that will aggregate the data, which in this case will be a COUNT function.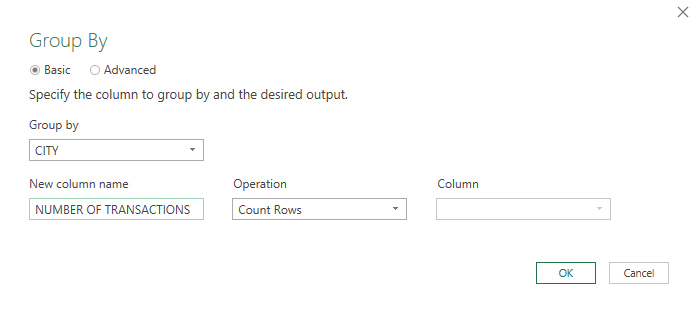
After confirming the selection the result is a table showing the number of sales transactions by city.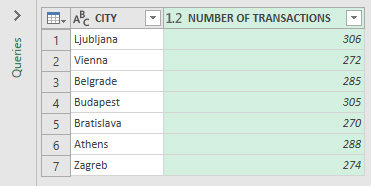
How do we get the amount of sales by cities and sales groups? Let’s select the CITY and SALES GROUP columns and then run the option to group the data. These columns will appear under the Group By section. Moving the mouse to the right of the column name in the list will bring up a menu where we can select the option to delete, move up, or move down column in the reporting hierarchy. We add a name to the New Column Name field, select the data summarization Function (SUM), and finally select the column which is used for aggregation. In this case it is the SALES column.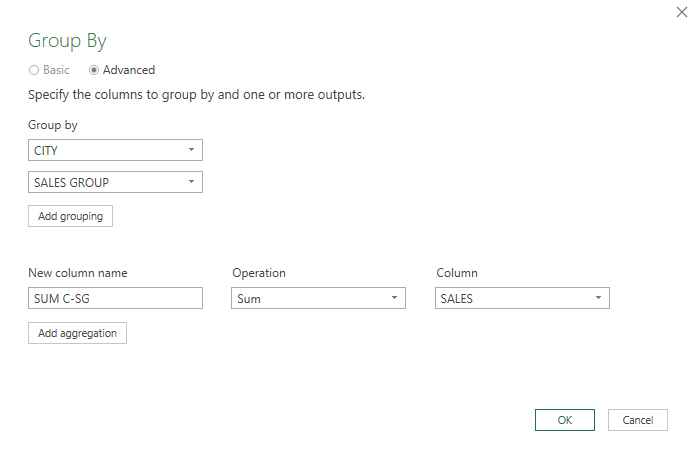
After confirming the selection the result is a table with values summarized by cities and sales groups. In the end, we just need to sort the values by city and sales group name to get a better looking report.