RANDARRAY function

One of the previous “recipes” was about randomly generated numbers, ie the use of the RANDBETWEEN function. The RANDARRAY function works similarly to the fact that, unlike the one mentioned above, it generates a random range of numbers (vector or a matrix) based on previously specified rules. This is one of the new Excel functions that is available only to Office 365 subscribers. Let’s see how it is works!
Filter FUNCTION

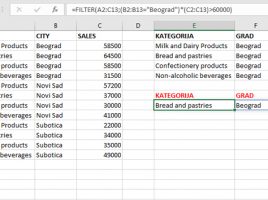
For some time now, Microsoft “evangelists” have been talking about about new Excel functions that make it possible to work with dynamic arrays. What is it about? Excel is enriched with a group of functions that provide dynamic content filtering. Since they finally became an integral part of Office 365 Excel in February this year, the following few “recipes” will, through simple examples, show you the new features they bring.

INTERCEPT and SLOPE

For a given series we can add a trend line which, by applying the selected mathematical function, approximates and shows the trend of data, which was discussed in one of the earlier posts. By displaying the value of R2 we can see how well we chose the function that approximates the data. How else can you improve the trend line appearance?

Cell attributes

Each cell in the worksheet can be blank or have some content (text, number). It can also have its own formatting elements. The CELL function allows you to read the attributes of a cell, however it is not nearly as powerful as the old GET.CELL macro function. In the following text, you will learn how to read cell attributes.

FREQUENCY function

The FREQUENCY function is used to calculate how often certain values ​​in a given range are repeated. This is an array function, and we can use it to calculate a distribution by which we can see how many points students have scored on a test and for other similar statistical analyzes. To help you understand how the function works will also illustrate this with a simple chart …