How strong is our competition?

When making Marketing Plan one of the activities being carried out is the analysis of competition. How strong is our competition? There are several ways to find this out, and this is perhaps most easily accomplished by tracking revenue and profit of competitors over several years. The following text will show you several Excel charts which should show where is our company and where are competitors on the market.

Break-Even point of profitability

Break-Even point is a method for calculating the profitability of a business. Income is calculated as the product quantity and the cost, and the costs are the sum of fixed costs and the product of the variable costs per unit with the amount. Therefore, breaking point is calculated by division of fixed costs and the difference of price and variable costs per unit of production. In following „recipe“ you will see the practical application of this method.

How to mix apples & oranges?

The term “mixed apples and oranges” is used to describe attempts to link some completely incompatible things. In Excel this often refers to making a strange conglomerate of a Pivot and traditional table. I personally never recommend it, but there are times when such reports are still necessary. With some ingenuity and little help of GETPIVOTDATA and OFFSET functions we’ll be able “to mix apples and oranges”. None of the above were hurt during the process!

Most important financial statements

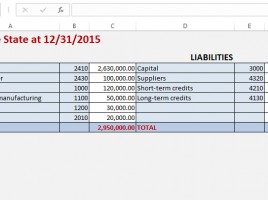
“No romance without finance” is part of the lyrics of ’90s hit which point to a major life truth: whatever job you’re doing, sooner or later you are going to review the financial statements. This is inevitable, because the insight into the structure of sources, assets, revenues, expenses and other financial indicators you can learn your position “in space and time ‘, or whether you are doing your job well or not, and where there is room for improvement.

Excel dashboards

What kind of reporting executives prefer? One that can fit on a single page! And to be timely, clear, beautiful and above all accurate – that goes without saying! Reporting table usually consist of tables, charts, or a combination of these elements with help of several important filters. Excel allows you to easily create beautiful and functional dashboards. This way it can replace or at least to postpone the purchase of expensive specialized software.