
Chart elements
Each chart consists of more elements that determine its appearance. This is, first of all, the way data are shown within a group (Data Series) or a single series (Data Point). Depending on the type of data, different charts are being used: Column, Bar, Line, Surface, Pie … Accordingly, the elements of such charts are: title, legend, axes, background … By adding or removing elements we ‘re getting the more effective report.
Chart elements can be added in many ways, and one of the ways to do this is by going to the Design ribbon, and there choosing Add Chart Element option that helps we do not omit any important element to visualize the data in the report.
The first element we can add are chart axes (of course, this only applies to those types of charts that have them). Axis can be horizontal and vertical. Horizontal contains data descriptions within one series, while vertical contains values. By selecting the More Axis Options on the right side of the window, a menu will be opened in which we can fine-tune numerous options related to axes like: minimum value, maximum value, steps etc.
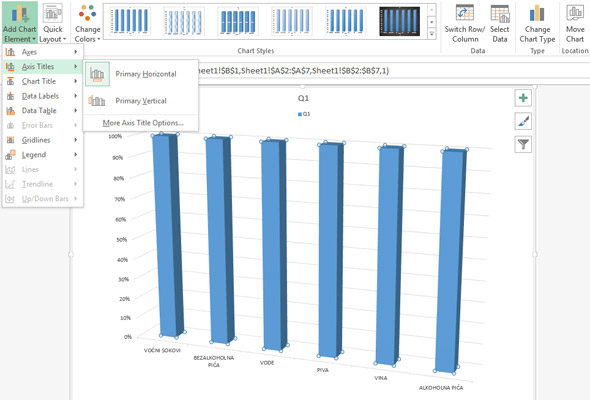
The second element we can add are Axis Titles. These are the text labels that describe the data and we can affect their appearance by changing font, its size, style, color, orientation…
In the 2D graph we can format the Gridlines and the Plot Area, and in the 3D Floor and Walls of the chart. Here we choose whether we want to show the gridlines, in which color, in what way … Also, we choose how the background of the chart will look and whether it will be a single color, a color gradient, a picture or a texture …
An important element is the Chart Title, as well as Legend. The title is the text field which describes the chart, and the legend automatically generates and displays the series names. For these elements we can change the look or orientation of the chart. First of all, this is the color and font size, as well as the way of displaying the background of the text.
Data Tables element allows you to show charts and corresponding data tables. This is a convenient option for simple charts.
The Data Labels option allows you to associate the series with labels that describe them closer. These are mostly numeric values, but may also be percentages or series names.
Each element can be formatted by clicking the right mouse button above it, and after opening the context menu, by choosing Format option which in the second part of the name contains the element name.
When adding elements to a chart, the golden rule applies: less is often more!
Careful combination of different elements should be achieved to ensure that the chart is neat, accurate and functional. Title and legend are, in most cases, desirable elements. The legend may sometimes be omitted or moved below the data. It is desirable that the chart has data axes, and sometimes the axes names. Data Labels are in most cases an indispensable element when it is necessary to emphasize individual values in the charts …