
Creating reporting dimensions
Reporting dimensions are all fields that you can see in the Fields menu, which are used to populate reports. Basically, these are the columns in the table model. Also, they can be Calculated Columns or Measures. In some earlier “recipes” I talked about how to create them in PowerPivot model, and now I will show you how to do perform this in PowerBI Desktop. Also, I will mention another interesting novelty: Calculated Tables!
First, a word or two about the terminology. Do not blame me, all those fields that can not be dragged into PowerPivot table or PowerBI reports to visualize data I call reporting dimensions. Formal policy is that dimensions that include numerical values (sums, averages, counts, etc.) are called Measures, and those which include business entities (Product Name, Partner name, Classification, Product group, Sales group, etc.) are called Dimensions. I use to call them all dimensions, if you know what I mean…
After you have imported and connected tables within a Model you can create Calculated Columns and Measures. To achieve this you should to go to Data View. To create them choose an appropriate option from New Measure menu in Home ribbon or one of the options from Modeling ribbon.
Let’s create Calculated Column! Go to the Home ribbon, open New Measure menu and select Column option. Enter appropriate DAX expression into formula box and save it by pressing ENTER. A new column will appear which will be populated with values.
On similar way you can create Measures. Open New Measure menu and choose option New Measure, then enter and save DAX expression.
After you create measures and calculated columns it would be good to format them immediately. That way, if you use them in reports, they will be presented in an appropriate manner. The default format is General, and for most measures you’ll want to choose Decimal or Whole Number format. Also, you can use formats such as Currency, Percent, etc. Formatting options are placed within Modeling ribbon.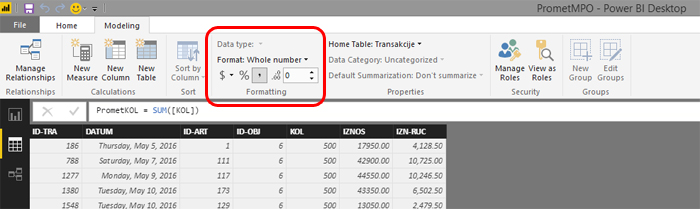
Calculated table is a novelty that brought by PowerBI. The point is that you can, by using DAX expression, to create a filter and save result as a completely new table which can be further used to create reports. It is done by going into Modeling ribbon and choosing option New Table. Then you should enter a DAX formula that filters a table. For example, if we want to filter table Artikli (Items) to show only classification Piva (Beer) should enter a formula:
Piva = FILTER(Artikli,Artikli[KLASIFIKACIJA]=”PIVA”)
A new table called „Piva“ will appear in Field list. It contains all articles that are some sort of beer.