Finding outliers
Outliers are values that differ significantly from other members of a statistical set. By analyzing outliers we can try to establish why they occurred in order to take some preventive or corrective actions. Using the example of sales analysis in the first four months of a year, you will learn how to detect exceptions and how to display them on a line chart.
To find outliers we should, based on all sales values, calculate first and third quartile. The first quartile (Q1) is the mean value between the minimum and the median, and the third quartile (Q3) is the mean value between the median and the maximum. Respectively, it is necessary to add formulas:
=QUARTILE($B$8:$B$123,1)
=QUARTILE($B$8:$B$123,3)
We will calculate the gap between the quartiles (IQR) as the difference between Q3 and Q1:
=B2-B1
We calculate the lower and upper limits using the formulas:
=B1-(1.5*B3)
=B2+(1.5*B3)
All sales values below the lower limit or above the upper limit are exceptions. To determine whether an element of the set is an exception, we should write the formula:
=OR(B8<B4,B8>B5)
If the sales value is an exception the formula returns TRUE, otherwise it returns FALSE.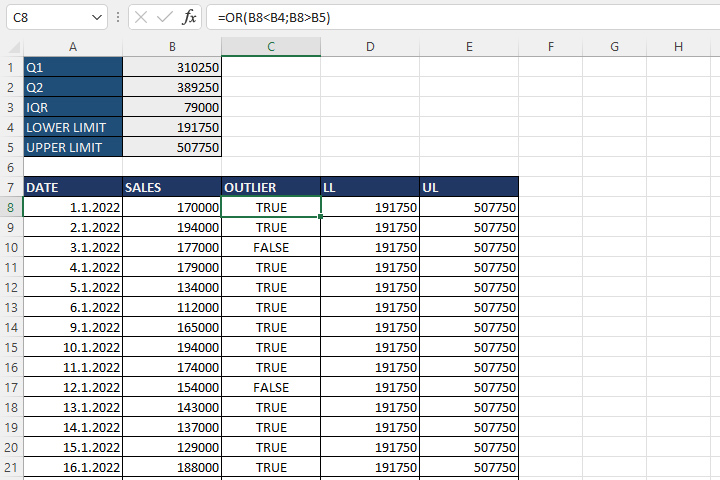
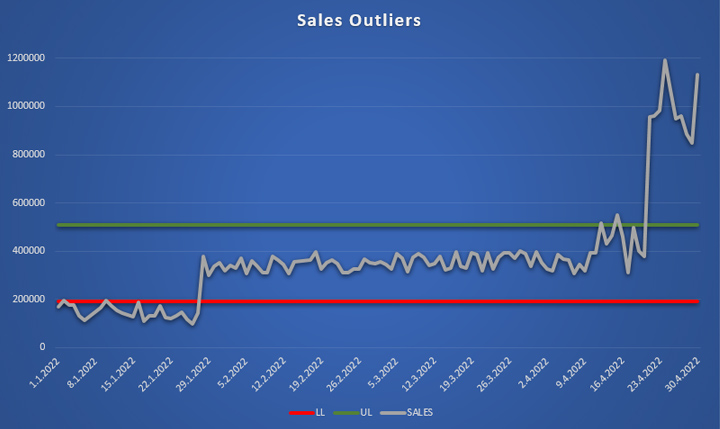
To show the outliers on the chart we will add two columns: the lower (LL) and upper limit (UL). We will show them on a line chart alongside the sales values where it’s easy to identify the outliers.