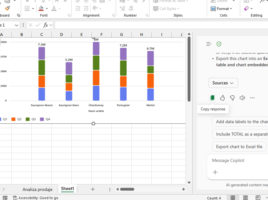
Marking the best-selling item

When we create a column chart to visualize data, the columns are often of different heights. We evaluate where the best sales were achieved visually or add data labels and then make the conclusion based on the appropriate numbers. Excel does not yet have conditional formatting for charts, but there’s a trick you can use to automatically determine the highest value in a series.

Autosave and versioning

Automatic saving of Excel documents has been around for a very long time. If you go to Excel Options, in the Save section, you will see the option to Save Autorecover Information Every… and the number of minutes after which the saving is performed. However, this works if your computer resets or for some other reason stops working. With the advent of the OneDrive repository and storing documents on it, we got a new, better Autosave…

Two dashes

Although Excel recognizes only two types of data: numbers and text, sometimes you’ll be working with Boolean values, such as TRUE and FALSE expressions. There is a simple trick to convert these values into ones and zeros respectively, so that you can add them more easily, and you will find out how to do this in a short “recipe” that follows.

Copilot in Excel documents

More recently, Microsoft Copilot, an AI-based assistant, has become an integral part of Excel in all its versions. Now it can help you, in English or another language, analyze data, create charts, offer you the appropriate Excel function, or show you its syntax. To put a long story short, it can make your daily work much more productive!

User-defined DAX functions

The DAX statement language, which we use to add new reporting dimensions to the Semantic Model, whether they are measures or calculated columns, or we use it to create tables, has a large number of functions. However, sometimes users need to create their own functions, and recently they can do it in a simple way, most often through DAX query view.