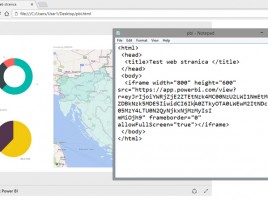
Excel add-ins

Office Store is a repository from which you can download a number of add-ins, arranged by categories, developed by the rich programming community, which gives you the ability to improve the reporting capabilities of Excel. Additions differ from traditional charts because they often have an interactivity element. Look at them as small apps that serve to improve the look of your reports.

Slicers in service of calculations

Slicers are graphic objects that are used as an interactive filters for filtering reports in Pivot and Power Pivot reports. In combination with certain DAX functions they can be used for setting the parameters of the calculation. The following recipe will show you how to do a sales report in which, according to chosen exchange rate, you can see results in different currencies. To test a status of a slicer will be used function HASONEVALUE.

From start to finish

DAX has lots of useful Time Intelligence functions and in this recipe I will pay some attention to these that filter aggregations according to beginning or the end of a period. My friends from ASEE would say: “From the cradle to the grave is the most beautiful is go-go phase”. However, in this recipe I would hold to quantitative results, and DAX helps us to determine them in the easy way (that’s my field of expertise)!

Cumulative sales overview

Reports often require that in addition to the usual review of the sales we create running total, i.e. to track cumulative growth of sales from beginning of the month, quarter or year. For this purpose we use the Time Intelligence functions DATESMTD, DATESQTD and DATESYTD by which we can track cumulative sales growth since the beginning of the given period. If you want to find out more please read the recipe that follows…

Same thing last year

Time Intelligence functions are often used for reviewing implementation of the goals at the same time last year. In what follows we will mention a few of DAX functions that cover this area. First, there is a function SAMEPERIODLASTYEAR which should monitor business results in the same period last year. And then there are functions DATEADD and PARALLELPERIOD by which we can monitor the achievement of objectives in the previous or next period (month, quarter, or year) in relation to the current data.