Allow Users to Edit Ranges

With Protect Sheet and Protect Workbook, a user can protect a worksheet or workbook so that only a person who knows the correct password can access them. However, what if we want to protect only part of the worksheet? Also, if more than one user is simultaneously working on the document, is it possible to grant them different access rights? Can the system administrator use domain rights for this purpose? Meet the Allow Users to Edit Ranges option.

Sales funnel

In addition to my passion for Excel my great love, and partly my job, is Customer Relationship Management (CRM). One of the most important CRM charts for tracking sales is the Sales funnel. Every salesman likes to see it on his dashboard at the beginning of working day, because with one look he can conclude whether the sale is standing or advancing. Funnel does not exist as a standard chart. It is created by modifying the 3D Column chart, and how to do it you will find out in the text that follows …

SmartArt

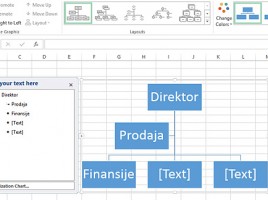
Flowchart diagrams can be made manually, by embedding and connecting different shapes. Also, we can make them based on some of the templates that come with Excel, and it belongs to the SmartArt schema group. SmartArt schemes are nothing more than diagram templates, created by creating and grouping objects. If you are well acquainted with them, they can greatly facilitate your work and shorten the time when making a diagram.

Arranging objects

When we use Excel to create a diagram, we add a few shapes that we later link with arrows to illustrate the flow of the process. All graphic objects can be aligned manually, by dragging them and matching the position with respect to another object. However, all this can be done much easier with the object editing options, where we can still position, group, ungroup objects …

Formatting objects

Since version 2007, Excel has been enriched with a wealth of options for “beautifying” reports, and from version to version it offers more of these functionalities that can be applied to the formatting of all graphic objects, whether these are charts or their elements, images, shapes, schemes … The following text will show how the appearance of the graphic object can change: its body, frames, the use of special formatting styles …